. 2003 Sep 2;100(18):10207-12.
doi: 10.1073/pnas.1733877100. Epub 2003 Aug 14.

Acetyl-CoA carboxylase 2 mutant mice are protected against obesity and diabetes induced by high-fat/high-carbohydrate diets

Affiliations

Acetyl-CoA carboxylase 2 mutant mice are protected against obesity and diabetes induced by high-fat/high-carbohydrate diets

Lutfi Abu-Elheiga et al. Proc Natl Acad Sci U S A. .

Abstract

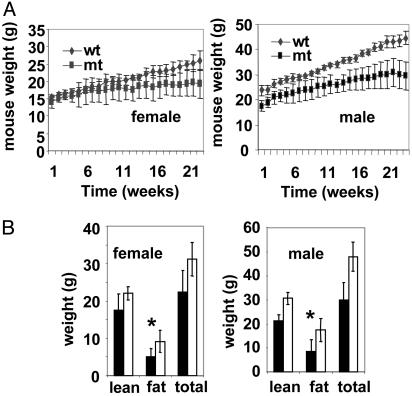
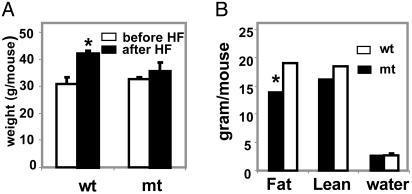
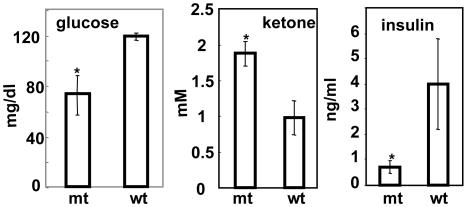
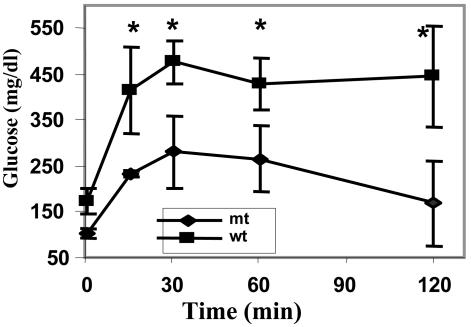
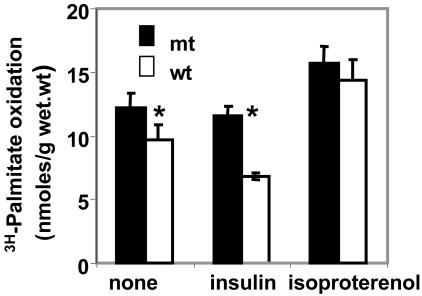
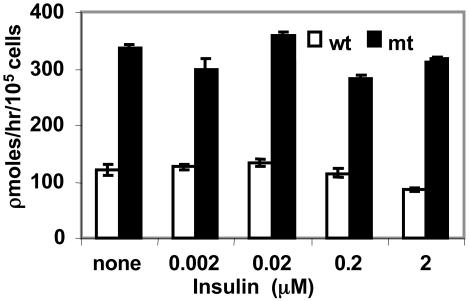
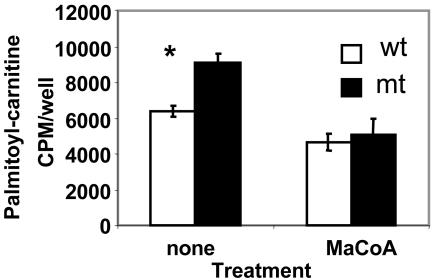
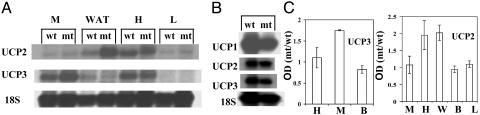
Malonyl-CoA, generated by acetyl-CoA carboxylases ACC1 and ACC2, is a key metabolite in the control of fatty acid synthesis and oxidation in response to dietary changes. ACC2 is associated to the mitochondria, and Acc2-/- mice have a normal lifespan and higher fatty acid oxidation rate and accumulate less fat. Mutant mice fed high-fat/high-carbohydrate diets weighed less than their WT cohorts, accumulated less fat, and maintained normal levels of insulin and glucose, whereas the WT mice became type-2 diabetic with hyperglycemic and hyperinsulinemic status. Fatty acid oxidation rates in the soleus muscle and in hepatocytes of Acc2-/- mice were significantly higher than those of WT cohorts and were not affected by the addition of insulin. mRNA levels of uncoupling proteins (UCPs) were significantly higher in adipose, heart (UCP2), and muscle (UCP3) tissues of mutant mice compared with those of the WT. The increase in the UCP levels along with increased fatty acid oxidation may play an essential role in the regulation of energy expenditure. Lowering intracellular fatty acid accumulation in the mutant relative to that of the WT mice may thus impact glucose transport by higher GLUT4 activity and insulin sensitivity. These results suggest that ACC2 plays an essential role in controlling fatty acid oxidation and is a potential target in therapy against obesity and related diseases.


Figures

Fig. 1.
Fig. 1.
Body weight of WT and Acc2-/- mutant (mt) mice fed a high-fat/high-carbohydrate diet. (A) Seven- to 8-week-old male and female mice (n = 9) were fed a special diet (32% of calories from fat and 38% from carbohydrate) for 24 weeks. The weight of each mouse within each group was measured weekly; the average and variance of the weights are shown. (B) Quantification of total body weight and fat and lean components in live mice in A using the dual-energy x-ray absorptiometry methods as described in Materials and Methods. Filled bars represent mutant and empty bars represent WT. *, P < 0.05, WT vs. mutant.
Fig. 2.
Fig. 2.
Body weight of WT and Acc2-/- mutant mice fed a high-fat diet. (A) Male mice of ≈30-g average weight (n = 3) were fed normal chow for 6 months before they were moved to a high-fat (HF) diet. After 3 months on this diet, mouse weight was measured. (B) Analysis of the fat, lean, and water (fluid) content of these mice by using the EchoMRI. The total body weight was measured for each mouse before the analysis (average weight was 35 and 43 g for mutant and WT, respectively). *, P < 0.05.
Fig. 3.
Fig. 3.
Serum constituents of WT and Acc2-/- mutant mice fed a high-fat/high-carbohydrate diet. Blood was collected from tail veins, and serum was collected after separation from cells. Glucose, insulin, and ketone bodies were determined as described in Materials and Methods. The data are shown as mean ± SD; n = 5 mice in each group. *, P < 0.05, WT vs. mutant.
Fig. 4.
Fig. 4.
Glucose tolerance test. Male animals were fasted for 6-8 h. d-Glucose (1.0 g/kg) was injected into the peritoneum of conscious mice (n = 5) of each WT and Acc2-/- mutant. Blood glucose levels were sampled at the indicated times. Glucose concentration before glucose administration is shown at time 0. *, P < 0.05, WT vs. mutant.
Fig. 5.
Fig. 5.
Fatty acid oxidation and the effect of insulin and isoproterenol on soleus muscle of Acc2-/- and WT mice. Two soleus muscle strips were isolated from each hind limb, and exogenous palmitate oxidation was measured as described in Materials and Methods in the presence and absence of insulin (1μM) and isoproterenol (1 μM) as indicated. One strip of soleus was incubated for 30 min, and the other strip from the same hind limb was incubated for 60 min for internal control. *, P < 0.05.
Fig. 6.
Fig. 6.
Fatty acid oxidation and the effect of insulin on hepatocytes prepared from livers of WT and Acc2-/- mice. Hepatocytes (105 cells) were grown in triplicates (in six-well plates) for 24 h. Fatty acid oxidation was determined at various insulin concentrations that were added at the start of the experiment. 3H2O was measured in the medium as described in Materials and Methods. Blank values were determined by adding methanol immediately to the culture.
Fig. 7.
Fig. 7.
CPT1 activity and its inhibition by malonyl-CoA in hepatocytes from WT and mutant mice. Hepatocytes (106 cells) were plated in DMEM with 10% FBS on six-well plates for 4 h. CPT1 activity was determined by formation of palmitoylcarnitine from 1 μCi of l-[3H]carnitine and 70 μM palmitoyl-CoA in the presence or absence of 50 μM malonyl-CoA. *, P < 0.05, WT vs. mutant.
Fig. 8.
Fig. 8.
Expression of UCP1, -2, and -3. (A and B) Representative Northern blots of total RNA (5-6 μg) prepared from the skeletal muscles, white adipose tissue, heart, liver, and brown adipose tissue of WT and Acc2-/- mutant mice. The filter was probed several times (after stripping) with the 32P-labeled cDNA fragments of UCP1, -2, and -3 and 18S ribosomal RNA (for quantification analysis). (C) Comparison of mRNA levels in different mouse tissues. B, brown adipose; L, liver; H, heart; M, skeletal muscle; W, white adipose. Data represent three Northern blots from WT and mutant mice that were hybridized with each UCP and 18S ribosomal RNA probe. The intensity of the band corresponds to each UCP normalized to the values of 18S mRNA signals. Values are mean ± SD.

Similar articles

Cited by

References

    1. Abu-Elheiga, L., Jayakumar, A., Baldini, A., Chirala, S. S. & Wakil, S. J. (1995) Proc. Natl. Acad. Sci. USA 92, 4011-4015. - PMC - PubMed
    1. Abu-Elheiga, L., Almarza-Ortega, D. B., Baldini, A. & Wakil, S. J. (1997) J. Biol. Chem. 272, 10669-10677. - PubMed
    1. Ha, J., Lee, J. K., Kim, K.-S., Witters, L. A. & Kim, K.-H. (1996) Proc. Natl. Acad. Sci. USA 93, 11466-11470. - PMC - PubMed
    1. Thampy, K. G. (1989) J. Biol. Chem. 264, 17631-17634. - PubMed
    1. Ha, J., Daniel, S., Broyles, S. & Kim, K. H. (1994) J. Biol. Chem. 269, 22162-22168. - PubMed

Publication types

MeSH terms