. 2003 Sep;73(3):580-90.
doi: 10.1086/378101. Epub 2003 Aug 14.

An integrated haplotype map of the human major histocompatibility complex

Affiliations

An integrated haplotype map of the human major histocompatibility complex

Emily C Walsh et al. Am J Hum Genet. 2003 Sep.

Abstract

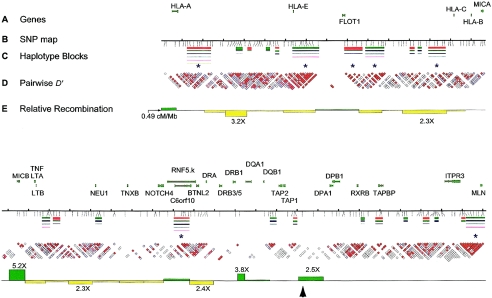
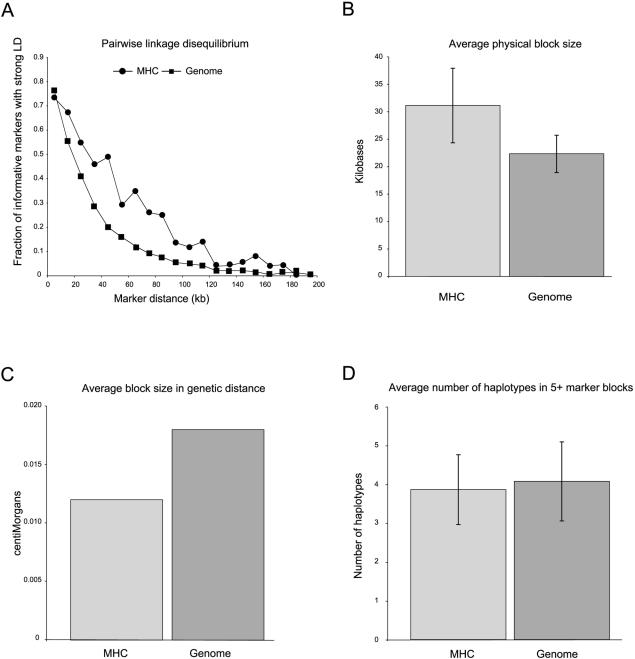
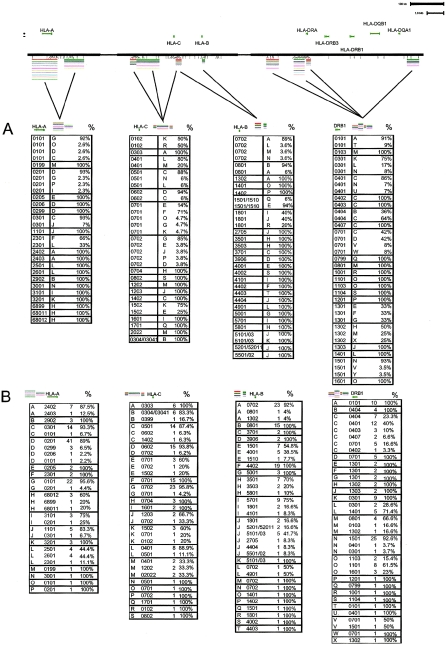
Numerous studies have clearly indicated a role for the major histocompatibility complex (MHC) in susceptibility to autoimmune diseases. Such studies have focused on the genetic variation of a small number of classical human-leukocyte-antigen (HLA) genes in the region. Although these genes represent good candidates, given their immunological roles, linkage disequilibrium (LD) surrounding these genes has made it difficult to rule out neighboring genes, many with immune function, as influencing disease susceptibility. It is likely that a comprehensive analysis of the patterns of LD and variation, by using a high-density map of single-nucleotide polymorphisms (SNPs), would enable a greater understanding of the nature of the observed associations, as well as lead to the identification of causal variation. We present herein an initial analysis of this region, using 201 SNPs, nine classical HLA loci, two TAP genes, and 18 microsatellites. This analysis suggests that LD and variation in the MHC, aside from the classical HLA loci, are essentially no different from those in the rest of the genome. Furthermore, these data show that multi-SNP haplotypes will likely be a valuable means for refining association signals in this region.


Figures

Figure  1
Figure 1
Integrated SNP map of the 4-Mb MHC in CEPH Europeans. A, Location and exon-intron structure provided for a subset of genes above the map, for positional reference. B, The 201 reliable, polymorphic SNPs are indicated on the map with ticks below the line. Ticks above the line are placed with 100-kb spacing. C, Haplotype blocks indicated below and common haplotype variants (>3% frequency) shown as colored lines (thickness indicates relative population frequency). Colors serve only to distinguish haplotypes and do not indicate block-to-block connections. Asterisks are found below the seven largest haplotype blocks. D, Pairwise D′ values (Lewontin 1964) for SNPs indicated below the haplotype blocks. Note that each block represents a single D′ calculation and is placed in the middle between the two SNPs analyzed. This is the same information as contained in the traditional D′ plot in the IDRG supplementary figure 1; only the data have been plotted in the X-axis, for ease of viewing with respect to the physical map. Red indicates strong LD and high confidence of the D′ estimate (D>0.95; LOD⩾3.0). Blue indicates strong LD with low confidence of the estimate of D′ (D=1; LOD<3.0). White indicates weak LD. E, Relative recombination rate, which is based on the sperm meiotic map, indicated in bar-graph form, where the value on the line is the regional average, 0.49 cM/Mb. Green bars indicate recombination rates >0.49 cM/Mb, and yellow bars indicate rates <0.49 cM/Mb. The black arrowhead denotes approximate location of well-mapped recombination rate from Jeffreys et al. (2001). SNP marker density in that region is too low to comment on any similarities between our studies. Note that five of seven long haplotype blocks map to regions where the recombination rate is ⩽0.49 cM/Mb. The remaining two long blocks are found in domains where recombination rates are 0.64 cM/Mb and 0.83 cM/Mb (rates below or near, respectively, the genomewide average).
Figure  2
Figure 2
Block comparison between the MHC and other autosomal regions from a genomewide survey. A, Plot of LD by physical distance revealing that LD is extended in the MHC. B, Accordingly, the average physical length of blocks in the MHC is longer than in the rest of the genome. C, However, measured by genetic distance, we observe that block size in the MHC is somewhat less than in the rest of the genome. D, The number of haplotype variants in blocks not spanning classical HLA genes is the same as elsewhere in the genome.
Figure  3
Figure 3
EHH analysis of haplotype blocks, microsatellites, HLA genes, and TAP genes in the region. EHH is computed as the percentage of instances in which two randomly selected chromosomes with the same variant locus have identical alleles at all SNPs assayed to a particular distance from that locus (e.g., an EHH of 0.5 at marker X means that 50% of possible pairings of a particular variant exhibit sequence identity from the locus to marker X.) A, Points representing the EHH at a distance of 0.25 cM from an allele at a particular locus. Outlying variants are indicated in color. The nine outlying variants define three extended haplotypes. Blue points indicate variants that map on the DRB1*1501 haplotype (associated with SLE and MS). Overlapping green points indicate variants C*0701 and D6S2840*219, which are both found on a haplotype associated with autoimmune diabetes, SLE, and hepatitis (DR3). The red point indicates DRB1*1101 (associated with pemphigoid disease). B, Recombination-distance-based map of the region. Microsatellites and genes for outlying EHH variants are indicated by ticks and above-line graphics, respectively. C, EHH values for loci that have at least one outlying variant. Outlying variants were seen at 7 of the 48 independent loci tested. The X-axis denotes distance in cM. EHH values are converted to grayscale values: EHH of 1 = black, EHH of 0.5 = 50% grayscale. Solid red lines indicate the locus about which values were derived. The red dotted lines indicate 0.25-cM distance at which outliers were assessed. Two HLA-C alleles, C*0702 and C*0701, are extended, as are two DRB1 alleles, DRB1*1501 and DRB1*1101. The other HLA gene alleles with extended haplotypes are DQA1*0102 and DQB1*0602. The microsatellite alleles with extended haplotypes are D6S2793*244, D6S2876*11, and D6S2840*219. Asterisks highlighting alleles are color coded by haplotype, as in A.
Figure  4
Figure 4
Correlation of HLA alleles to SNP haplotype background. Map of region showing placement of SNPs and haplotypes assayed is shown for reference. Multi-SNP haplotypes are coded by single capital letters. A, SNP-HLA haplotypes sorted by HLA allele. Percents indicate the percentage of a particular HLA allele that falls on the indicated SNP haplotype. B, SNP-HLA haplotypes sorted by SNP haplotype allele. Percents indicate the percentage of a particular SNP haplotype allele that bears the indicated HLA allele. Counts are overall number of chromosomes bearing the SNP-HLA haplotype indicated.

Similar articles

Cited by

References

Electronic-Database Information

    1. Coriell Institute, http://locus.umdnj.edu/ccr/
    1. dbSNP, http://www.ncbi.nlm.nih.gov/SNP/
    1. IDRG, http://www-genome.wi.mit.edu/mpg/idrg/projects/hla.html (for supplementary “Materials and Methods” information and pairwise D′ analysis for 201 reliable, polymorphic SNP assays in 18 multigenerational European CEPH families)
    1. Online Mendelian Inheritance in Man (OMIM), http://www.ncbi.nlm.nih.gov/Omim/ (for SLE, MS, IDDM, thyroid disease, and autoimmune diabetes)

References

    1. Allcock RJ, Atrazhev AM, Beck S, de Jong PJ, Elliott JF, Forbes S, Halls K, Horton R, Osoegawa K, Rogers J, Sawcer S, Todd JA, Trowsdale J, Wang Y, Williams S (2002) The MHC haplotype project: a resource for HLA-linked association studies. Tissue Antigens 59:520–521 - PubMed
    1. Alper CA, Awdeh Z, Yunis EJ (1992) Conserved, extended MHC haplotypes. Exp Clin Immunogenet 9:58–71 - PubMed
    1. Barcellos LF, Oksenberg JR, Green AJ, Bucher P, Rimmler JB, Schmidt S, Garcia ME Lincoln RR, Pericak-Vance MA, Haines JL, Hauser SL, Multiple Sclerosis Genetic Group (2002) Genetic basis for clinical expression in multiple sclerosis. Brain 125:150–158 - PubMed
    1. Beck S, Trowsdale J (2000) The human major histocompatability complex: lessons from the DNA sequence. Annu Rev Genomics Hum Genet 1:117–137 - PubMed
    1. Begovich AB, McClure GR, Suraj VC, Helmuth RC, Fildes N, Bugawan TL, Erlich HA, Klitz W (1992) Polymorphism, recombination, and linkage disequilibrium within the HLA class II region. J Immunol 148:249–258 - PubMed

Publication types