

Action potential changes associated with a slowed inactivation of cardiac voltage-gated sodium channels by KB130015
- PMID: 12922934
- PMCID: PMC1573977
- DOI: 10.1038/sj.bjp.0705379
Action potential changes associated with a slowed inactivation of cardiac voltage-gated sodium channels by KB130015
Abstract
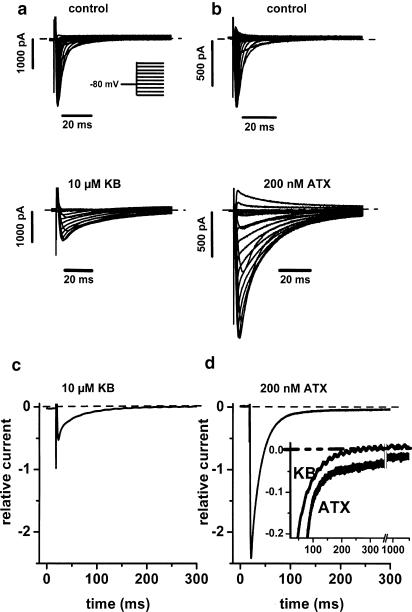
1. We have studied the acute cardiac electrophysiological effects of KB130015 (KB), a drug structurally related to amiodarone. Membrane currents and action potentials were measured at room temperature or at 37 degrees C during whole-cell patch-clamp recording in ventricular myocytes. Action potentials were also measured at 37 degrees C in multicellular ventricular preparations. 2. The effects of KB were compared with those of anemone toxin II (ATX-II). Both KB and ATX-II slowed the inactivation of the voltage-gated Na(+) current (I(Na)). While KB shifted the steady-state voltage-dependent inactivation to more negative potentials, ATX-II shifted it to more positive potentials. In addition, while inactivation proceeded to completion with KB, a noninactivating current was induced by ATX-II. 3. KB had no effect on I(K1) but decreased I(Ca-L) The drug also did not change I(to) in mouse myocytes. 4. The action potential duration (APD) in pig myocytes or multicellular preparations was not prolonged but often shortened by KB, while marked APD prolongation was obtained with ATX-II. Short APDs in mouse were markedly prolonged by KB, which frequently induced early afterdepolarizations. 5. A computer simulation confirmed that long action potentials with high plateau are relatively less sensitive to a mere slowing of I(Na) inactivation, not associated with a persisting, noninactivating current. In contrast, simulated short action potentials with marked phase-1 repolarization were markedly modified by slowing I(Na) inactivation. 6 It is suggested that a prolongation of short action potentials by drugs or mutations that only slow I(Na) inactivation does not necessarily imply identical changes in other species or in different myocardial regions.
Figures


Similar articles
-
ATX-II effects on the apparent location of M cells in a computational model of a human left ventricular wedge.J Cardiovasc Electrophysiol. 2006 May;17 Suppl 1:S86-S95. doi: 10.1111/j.1540-8167.2006.00389.x. J Cardiovasc Electrophysiol. 2006. PMID: 16686688
-
The effects of paeonol on the electrophysiological properties of cardiac ventricular myocytes.Eur J Pharmacol. 2006 Sep 18;545(2-3):87-92. doi: 10.1016/j.ejphar.2006.06.064. Epub 2006 Jul 1. Eur J Pharmacol. 2006. PMID: 16876781
-
Slowing of the inactivation of cardiac voltage-dependent sodium channels by the amiodarone derivative 2-methyl-3-(3,5-diiodo-4-carboxymethoxybenzyl)benzofuran (KB130015).J Pharmacol Exp Ther. 2003 Jan;304(1):130-8. doi: 10.1124/jpet.102.042218. J Pharmacol Exp Ther. 2003. PMID: 12490583
-
The role of late I and antiarrhythmic drugs in EAD formation and termination in Purkinje fibers.J Cardiovasc Electrophysiol. 2006 May;17 Suppl 1:S71-S78. doi: 10.1111/j.1540-8167.2006.00386.x. J Cardiovasc Electrophysiol. 2006. PMID: 16686685 Review.
-
Actions of emigrated neutrophils on Na(+) and K(+) currents in rat ventricular myocytes.Prog Biophys Mol Biol. 2006 Jan-Apr;90(1-3):249-69. doi: 10.1016/j.pbiomolbio.2005.07.003. Epub 2005 Aug 9. Prog Biophys Mol Biol. 2006. PMID: 16165196 Review.
Cited by
-
Distinct effects of obesity and diabetes on the action potential waveform and inward currents in rat ventricular myocytes.Clin Sci (Lond). 2025 Jan 15;139(1):55-67. doi: 10.1042/CS20242144. Clin Sci (Lond). 2025. PMID: 39693640 Free PMC article.
-
Paclitaxel mitigates structural alterations and cardiac conduction system defects in a mouse model of Hutchinson-Gilford progeria syndrome.Cardiovasc Res. 2022 Jan 29;118(2):503-516. doi: 10.1093/cvr/cvab055. Cardiovasc Res. 2022. PMID: 33624748 Free PMC article.
-
Screening for acute IKr block is insufficient to detect torsades de pointes liability: role of late sodium current.Circulation. 2014 Jul 15;130(3):224-34. doi: 10.1161/CIRCULATIONAHA.113.007765. Epub 2014 Jun 3. Circulation. 2014. PMID: 24895457 Free PMC article.
-
A Na+ channel agonist: a potential cardiotonic agent with a novel mechanism?Br J Pharmacol. 2004 Nov;143(6):663-5. doi: 10.1038/sj.bjp.0705970. Epub 2004 Oct 18. Br J Pharmacol. 2004. PMID: 15492018 Free PMC article. Review. No abstract available.
-
A novel Na+ channel agonist, dimethyl lithospermate B, slows Na+ current inactivation and increases action potential duration in isolated rat ventricular myocytes.Br J Pharmacol. 2004 Nov;143(6):765-73. doi: 10.1038/sj.bjp.0705969. Epub 2004 Oct 25. Br J Pharmacol. 2004. PMID: 15504759 Free PMC article.
References
-
- AMOS G.J., RAVENS U. The inotropic agents DPI 201-106 and BDF 9148 differentially affect potassium currents of guinea-pig ventricular myocytes. Naunyn Schmiedebergs Arch. Pharmacol. 1994;350:426–433. - PubMed
-
- BALSER J.R. The cardiac sodium channel: gating function and molecular pharmacology. J. Mol. Cell. Cardiol. 2001;33:599–613. - PubMed
-
- BENNETT P.B. Long QT syndrome: biophysical and pharmacologic mechanisms in LQT3. J. Cardiovasc. Electrophysiol. 2000;11:819–822. - PubMed
-
- BEZZINA C.R., ROOK M.B., WILDE A.A. Cardiac sodium channel and inherited arrhythmia syndromes. Cardiovasc. Res. 2001;49:257–271. - PubMed
-
- BOUTJDIR M., RESTIVO M., WEI Y., STERGIOPOULOS K., EL-SHERIF N. Early afterdepolarization formation in cardiac myocytes: analysis of phase plane patterns, action potential, and membrane currents. J. Cardiovasc. Electrophysiol. 1994;5:609–620. - PubMed
Publication types
MeSH terms
Substances
LinkOut - more resources
Full Text Sources
Other Literature Sources
