

Association of the RENT complex with nontranscribed and coding regions of rDNA and a regional requirement for the replication fork block protein Fob1 in rDNA silencing
- PMID: 12923057
- PMCID: PMC196457
- DOI: 10.1101/gad.1108403
Association of the RENT complex with nontranscribed and coding regions of rDNA and a regional requirement for the replication fork block protein Fob1 in rDNA silencing
Abstract
Silencing within the yeast rDNA repeats inhibits hyperrecombination, represses transcription from foreign promoters, and extends replicative life span. rDNA silencing is mediated by a Sir2-containing complex called RENT (regulator of nucleolar silencing and telophase exit). We show that the Net1 (also called Cfi1) and Sir2 subunits of RENT localize primarily to two distinct regions within rDNA: in one of the nontranscribed spacers (NTS1) and around the Pol I promoter, extending into the 35S rRNA coding region. Binding to NTS1 overlaps the recombination hotspot and replication fork barrier elements, which have been shown previously to require the Fob1 protein for their activities. In cells lacking Fob1, silencing and the association of RENT subunits are abolished specifically at NTS1, while silencing and association at the Pol I promoter region are unaffected or increased. We find that Net1 and Sir2 are physically associated with Fob1 and subunits of RNA polymerase I. Together with the localization data, these results suggest the existence of two distinct modes for the recruitment of the RENT complex to rDNA and reveal a role for Fob1 in rDNA silencing and in the recruitment of the RENT complex. Furthermore, the Fob1-dependent associations of Net1 and Sir2 with the recombination hotspot region strongly suggest that Sir2 acts directly at this region to carry out its inhibitory effect on rDNA recombination and accelerated aging.
Figures
 ) and autonomously
replicating sequences (
) and autonomously
replicating sequences ( ) are indicated. Vertical arrows indicate
insertion sites of silencing reporters. (R1)
NTS1::Ty1–mURA3; (R2)
NTS2::Ty1–mURA3; (R3) NTS1::mURA3;
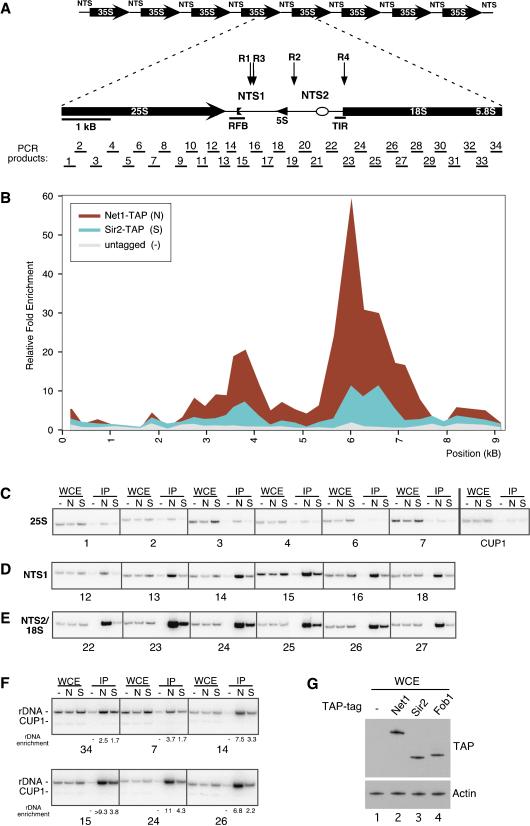
(R4) NTS2::mURA3. PCR products analyzed in ChIP assays are
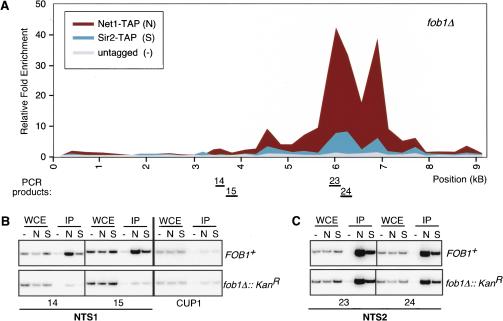
indicated below the rDNA unit. (B) Representative graph
showing the associations of Net1–TAP and Sir2–TAP within the rDNA
repeat. Relative fold enrichment refers to the relative ratio of PCR products
amplified from immunoprecipitated DNA to products from whole-cell extract DNA
(see Materials and Methods). Positions along rDNA correspond to the physical
map shown in A. (C) Examples of the ChIP data used to
calculate enrichment at the 25S region of rDNA. The numbers below the
panels refer to the PCR products shown in A. CUP1 primers were used
as a control. WCE and IP refer to products amplified from whole-cell extracts
and immunoprecipitated DNA, respectively. Untagged control (–),
Net1–TAP (N), and Sir2–TAP (S) cells are indicated above
lanes. (D) Same as in C but showing amplified DNA from the
NTS1 region. (E) Same as in C but showing amplified DNA from
the NTS2/18S region. (F) Multiplex PCR with rDNA and CUP1
primers showing rDNA enrichment. (G) Western blot showing the
relative abundance of TAP-tagged proteins in whole-cell extracts (WCE)
prepared from untagged (lane 1) or Net1–TAP, Sir2–TAP, or
Fob1–TAP strains (lanes 2–4).
) are indicated. Vertical arrows indicate
insertion sites of silencing reporters. (R1)
NTS1::Ty1–mURA3; (R2)
NTS2::Ty1–mURA3; (R3) NTS1::mURA3;
(R4) NTS2::mURA3. PCR products analyzed in ChIP assays are
indicated below the rDNA unit. (B) Representative graph
showing the associations of Net1–TAP and Sir2–TAP within the rDNA
repeat. Relative fold enrichment refers to the relative ratio of PCR products
amplified from immunoprecipitated DNA to products from whole-cell extract DNA
(see Materials and Methods). Positions along rDNA correspond to the physical
map shown in A. (C) Examples of the ChIP data used to
calculate enrichment at the 25S region of rDNA. The numbers below the
panels refer to the PCR products shown in A. CUP1 primers were used
as a control. WCE and IP refer to products amplified from whole-cell extracts
and immunoprecipitated DNA, respectively. Untagged control (–),
Net1–TAP (N), and Sir2–TAP (S) cells are indicated above
lanes. (D) Same as in C but showing amplified DNA from the
NTS1 region. (E) Same as in C but showing amplified DNA from
the NTS2/18S region. (F) Multiplex PCR with rDNA and CUP1
primers showing rDNA enrichment. (G) Western blot showing the
relative abundance of TAP-tagged proteins in whole-cell extracts (WCE)
prepared from untagged (lane 1) or Net1–TAP, Sir2–TAP, or
Fob1–TAP strains (lanes 2–4).
Similar articles
-
Replication fork arrest and rDNA silencing are two independent and separable functions of the replication terminator protein Fob1 of Saccharomyces cerevisiae.J Biol Chem. 2010 Apr 23;285(17):12612-9. doi: 10.1074/jbc.M109.082388. Epub 2010 Feb 23. J Biol Chem. 2010. PMID: 20179323 Free PMC article.
-
Mechanism of Regulation of Intrachromatid Recombination and Long-Range Chromosome Interactions in Saccharomyces cerevisiae.Mol Cell Biol. 2016 May 2;36(10):1451-63. doi: 10.1128/MCB.01100-15. Print 2016 May 15. Mol Cell Biol. 2016. PMID: 26951198 Free PMC article.
-
Inhibition of homologous recombination by a cohesin-associated clamp complex recruited to the rDNA recombination enhancer.Genes Dev. 2006 Oct 15;20(20):2887-901. doi: 10.1101/gad.1472706. Genes Dev. 2006. PMID: 17043313 Free PMC article.
-
A model for step-wise assembly of heterochromatin in yeast.Novartis Found Symp. 2004;259:48-56; discussion 56-62, 163-9. Novartis Found Symp. 2004. PMID: 15171246 Review.
-
SIRT1 regulates the ribosomal DNA locus: epigenetic candles twinkle longevity in the Christmas tree.Biochem Biophys Res Commun. 2009 Jan 2;378(1):6-9. doi: 10.1016/j.bbrc.2008.11.023. Epub 2008 Nov 21. Biochem Biophys Res Commun. 2009. PMID: 19010308 Review.
Cited by
-
Distinct roles for the essential MYST family HAT Esa1p in transcriptional silencing.Mol Biol Cell. 2006 Apr;17(4):1744-57. doi: 10.1091/mbc.e05-07-0613. Epub 2006 Jan 25. Mol Biol Cell. 2006. PMID: 16436512 Free PMC article.
-
The amino terminus of the Saccharomyces cerevisiae DNA helicase Rrm3p modulates protein function altering replication and checkpoint activity.Genetics. 2004 Nov;168(3):1205-18. doi: 10.1534/genetics.104.028035. Genetics. 2004. PMID: 15579680 Free PMC article.
-
Budding yeast silencing complexes and regulation of Sir2 activity by protein-protein interactions.Mol Cell Biol. 2004 Aug;24(16):6931-46. doi: 10.1128/MCB.24.16.6931-6946.2004. Mol Cell Biol. 2004. PMID: 15282295 Free PMC article.
-
Functional complementation of sir2Δ yeast mutation by the human orthologous gene SIRT1.PLoS One. 2013 Dec 11;8(12):e83114. doi: 10.1371/journal.pone.0083114. eCollection 2013. PLoS One. 2013. PMID: 24349441 Free PMC article.
-
Yeast mother cell-specific ageing, genetic (in)stability, and the somatic mutation theory of ageing.Nucleic Acids Res. 2007;35(22):7514-26. doi: 10.1093/nar/gkm919. Epub 2007 Nov 6. Nucleic Acids Res. 2007. PMID: 17986449 Free PMC article. Review.
References
-
- Braunstein M., Rose, A.B., Holmes, S.G., Allis, C.D., and Broach, J.R. 1993. Transcriptional silencing in yeast is associated with reduced nucleosome acetylation. Genes & Dev. 7: 592–604. - PubMed
-
- Brewer B.J. and Fangman, W.L. 1988. A replication fork barrier at the 3′ end of yeast ribosomal RNA genes. Cell 55: 637–643. - PubMed
-
- Bryk M., Banerjee, M., Murphy, M., Knudsen, K.E., Garfinkel, D.J., and Curio, M.J. 1997. Transcriptional silencing of Ty1 elements in the RDN1 locus of yeast. Genes & Dev. 11: 255–269. - PubMed
Publication types
MeSH terms
Substances
LinkOut - more resources
Full Text Sources
Other Literature Sources
Molecular Biology Databases