. 2003 Nov 1;552(Pt 3):881-905.
doi: 10.1113/jphysiol.2003.046573. Epub 2003 Aug 15.

Cellular interactions in the rat somatosensory thalamocortical system during normal and epileptic 5-9 Hz oscillations

Affiliations

Cellular interactions in the rat somatosensory thalamocortical system during normal and epileptic 5-9 Hz oscillations

Didier Pinault. J Physiol. .

Abstract

In Genetic Absence Epilepsy Rats from Strasbourg (GAERS), generalized spike-and-wave (SW) discharges (5-9 SW s(-1)) develop during quiet immobile wakefulness from a natural, medium-voltage, 5-9 Hz rhythm. This study examines the spatio-temporal dynamics of cellular interactions in the somatosensory thalamocortical system underlying the generation of normal and epileptic 5-9 Hz oscillations. Paired single-unit and multi-unit recordings between the principal elements of this circuit and intracellular recordings of thalamic, relay and reticular, neurones were conducted in neuroleptanalgesied GAERS and control, non-epileptic, rats. The identity of the recorded neurones was established following juxtacellular or intracellular marking. At least six major findings have emerged from this study. (1) In GAERS, generalized spike-and-wave discharges were correlated with synchronous rhythmic firings in related thalamic relay and reticular neurones. (2) Usually, corticothalamic discharges phase-led related relay and reticular firings. (3) A depolarizing wave emerging from a barrage of EPSPs was the cause of both relay and reticular discharges. (4) In some relay cells, which had a relatively high membrane input resistance, the depolarizing wave had the shape of a ramp, which could trigger a low-threshold Ca2+ spike. (5) In reticular cells, the EPSP barrage could further trigger voltage-dependent depolarizations. (6) The epilepsy-related thalamic, relay and reticular, intracellular activities were similar to the normal-related thalamic activities. Overall, these findings strongly suggest that, during absence seizures, corticothalamic neurones play a primary role in the synchronized excitation of thalamic relay and reticular neurones. The present study further suggests that absence-related spike-and-wave discharges correspond to hypersynchronous wake-related physiological oscillations.


Figures
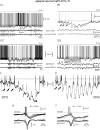
Figure 6
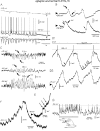
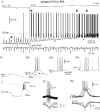
Figure 6. Thalamocortical intracellular activities associated with epileptic and normal 5–9 Hz oscillations
Thalamocortical intracellular activity associated with spontaneously occurring spike-and-wave discharges (A1 and A2) or normal 5–9 Hz oscillations (B1 and B2). The grey area in B2 is expanded in D. C, a rhythmic depolarizing wave-hyperpolarizing wave sequence occurring in parallel with the development of a tonic hyperpolarization associated with normal 5–9 Hz ECoG oscillations. Note that, in C, the hyperpolarizing wave progressively decreases in amplitude during the development of the tonic hyperpolarization. In its depth, a depolarizing wave triggers an apparent low-threshold Ca2+ spike (asterisk, expanded in Fig. 7E). E and F, temporal relationship between the thalamocortical depolarizing wave-hyperpolarizing wave sequence with the SW complex (5 superimposed sequences). The relay cell in F displays a hyperpolarization-activated depolarizing sag to square pulses of constant hyperpolarizing current whereas the cell in E does not. Every curved arrow in A!, B1, B2, C, and D indicates an EPSP barrage. The horizontal dotted line indicates the AP threshold (−58 mV) at rest. The APs are clipped in B1, C, D, E and F.
Figure 7
Figure 7. The thalamocortical depolarizing wave includes a barrage of EPSPs
A, response of a TC neurone to a hyperpolarizing ramp current applied just before the end of a spontaneous SWD. The rhythmic hyperpolarizing wave reverses at −69 mV. B, recorded at two different membrane potentials, two successive depolarizing wave-hyperpolarizing wave sequences associated with normal 5–9 Hz ECoG oscillations. Individual depolarizing potentials (straight arrows) are revealed in the depth of hyperpolarizations. This TC cell does not display an apparent depolarizing sag during the application of a hyperpolarizing current pulse. C, three SWD-related traces recorded at different membrane potentials with a QX-314-filled micropipette. In B and C, every curved arrow indicates either an EPSP barrage (e), an IPSP barrage (i), or an EPSP-IPSP barrage (e + i). D1, three successive depolarizing waves, the ascending slope of one of these occurring during the injection of a 100 ms square pulse constant hyperpolarizing current (−0.2 nA). D2, three successive depolarizing waves (from neurone of Fig. 6B2) recorded while injecting a sustained hyperpolarizing current (−0.5 nA). E, initial part of a depolarizing wave (the one indicated by an asterisk in Fig. 6C), which apparently includes individual synaptic depolarizing potentials (straight arrows) and a low-threshold Ca2+ spike. F, a typical depolarizing wave recorded with a QX-filled micropipette. G, typical TC intracellular events (action potentials clipped for clarity) occurring during mechanical stimulation of the receptive field. On the rat is shown the location of the receptive field (in black) gently activated by the experimenter's hand.
Figure 5
Figure 5. Electrophysiological features of two thalamocortical neurones, A and B, of the somatosensory thalamus
These two cells were recorded in the control non-epileptic strain. They had a membrane input resistance of 31.0 ± 8.7 and of 12.4 ± 3.3 MΩ, respectively. A1 and B1, superimposed traces of responses of the thalamocortical neurone to a square pulse of constant hyperpolarizing current of increasing intensity. In B1, note the spontaneous occurrence of identified lemniscal EPSPs. A2 and B2, rhythmic activity associated with spontaneously occurring 5–9 Hz oscillations in the related surface electrocorticogram (ECoG). In A3, the curved arrows indicate individual depolarizing potentials. The grey areas are expanded in A3 and B3. C, plot of the amplitude of the decaying voltage responses occurring during hyperpolarizing current pulses (Vsag, see A1) vs. either the initial membrane potential (MP, see A1; from 20 and 21 cells in control NE rats (open symbols) and in GAERS (filled symbols), respectively), or the peak membrane input resistance at rest (PIR; sag values measured at a MP between −80 and −90 mV).
Figure 1
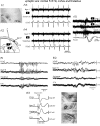
Figure 1. Single-cell anatomo-electrophysiology of somatosensory-related corticothalamic, thalamocortical, and reticular thalamic neurones in whole animal preparation
A1 and A2, juxtacellular staining of simultaneously recorded CT and TC neurones, respectively. The corresponding recording traces are shown in Fig. 3A. A3, partial reconstruction of the CT neurone of A1. B, schema illustrating the location of the recording micropipettes in the somatosensory thalamus (ventral posteromedial thalamic nucleus and the corresponding RTN sector) and of the Ag–AgCl ECoG electrode in the related frontoparietal cortex. The stereotaxic plates (in mm from bregma) are drawn from the Paxinos & Watson's atlas (1986). Note that minimal craniotomies were made for the insertion of the micropipettes, and that the frontoparietal cortex was not directly injured by the corresponding craniotomy. C1, antidromic activation of a recorded TC neurone of the somatosensory thalamus following layer IV electrical stimulation, which is located below the ECoG recording site. When the antidromic AP is triggered immediately after a spontaneously occurring orthodromic AP, it cannot be recorded because of collision (curved arrow). C2, orthodromic activation of a RTN cell of the somatosensory sector following layer IV electrical stimulation. Cx stim, cortical stimulation. D1 and D2, juxtacellular marking of simultaneously recorded TC and RTN neurones, respectively. CL, central lateral; CM, central medial; CPu, caudate putamen; ep, entopedoncular; ic, internal capsule; LD, lateral dorsal; MD, medial dorsal; Po, posterior thalamic nuclear group; VL, ventral lateral; VM, ventral medial; VPl, ventral posterolateral; VPm, ventral posteromedial; WM, white matter; ZI, zona incerta.
Figure 3
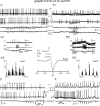
Figure 3. Dual recordings of a corticothalamic neurone with either a thalamocortical (A1–A3 and D), or a reticular thalamic (B1–B3 and E) cell during spontaneous spike-and-wave discharges
A2 and B2, five superimposed successive recordings of SW-related AP discharges. A3, B3, cross-correlograms (2 ms resolution) computed from pair recordings. C, means and standard deviations of the time relationship between the CT, TC, and RTN AP discharges and the SW complex (CT: −19.4 ± 8.8 ms, 88 SW complexes from 4 rats; RTN: −11.9 ± 7.3 ms, 108 SW complexes from 6 rats; TC: −12.6 ± 8.2 ms, 133 SW complexes, 7 rats. In D, the asterisks indicate the beginning of the CT rhythmic discharge, which starts before both the TC rhythmic firing and the occurrence of the seizure.
Figure 4
Figure 4. Dual multi-unit (A) and triple extracellular field potential (B) recordings of somatosensory-related thalamic and cortical sites along with spontaneously occurring spike-and-wave discharges (A and B1) or normal 5–9 Hz oscillations (B2) in the ECoG
A1–4, a typical example of paired multi-unit (bandpass: 0.3–6 kHz), thalamic and cortical, recordings. The thalamic recording is performed in the somatosensory thalamus (staining not shown). The intracortical recordings are performed at different depths below the ECoG recording site (A2). The last intracortical recording corresponds to the deeper site, which is marked following extracellular micro-iontophoretic application of Neurobiotin (A1). A2, the drawing indicates two sites recorded from in layer V and layer VI (asterisks). The corresponding records are shown in A3 and in A4, respectively. A5, mounting of three time-matching superimpositions of layer V, layer VI, and thalamic multi-unit recordings from another experiment. B3, evoked potentials following electrical stimulation of the contralateral forepaw. The photomicrographs (up = dorsal; right = lateral) show large extracellular applications (epicentre indicated by a white asterisk) of dextran biotin amine where extracellular field potential recordings were carried out simultaneously in the somatosensory system, that is, from top to bottom, in layer VI, in the thalamus, and in the reticular thalamic nucleus (RTN). In B1 and B2, the bandpass was 0.1 Hz–6kHz). CPu, caudate putamen; ic, internal capsule; VPl, ventral posterolateral thalamic nucleus; VPm, ventral posteromedial thalamic nucleus; WM, white matter.
Figure 2
Figure 2. Simultaneous thalamocortical and reticular thalamic extracellular activities associated with spontaneous medium-voltage (A) or high-voltage (B) 5–9 Hz ECoG oscillations
Recordings in A and B are from the same TC–RTN pair in a GAERS. The framed traces (in grey in A1 and B1) are expanded in A2 and B2. C and D, superimposition of four representative cross-correlograms (2 ms resolution) computed from four paired recordings obtained during normal (C) or epileptic (D) 5–9 Hz oscillations. ipsi, ipsilateral; contra, contralateral.
Figure 10
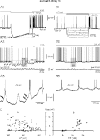
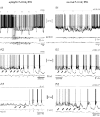
Figure 10. Voltage-dependent features of RTN depolarizing wave-hyperpolarizing wave sequence
A and B1-B4, in a typical experiment, the intracellular current (top trace in A) was progressively increased from −0.41 to +1 nA (100 ms current pulses of −0.4 nA every 2 s). The record is truncated (area in grey) for clarity. Four depolarizing waves topped or not by action potentials, indicated by asterisks in A, are expanded below (B1-B4). The second one (B2) is overlaid at the same temporal scale with two barrages of EPSPs, one (•) that occurs at the same membrane potential and does not reach the triggering threshold of a depolarizing hump crowned by action potentials, the second (curved arrow) that is the EPSP barrage recorded in Fig. 11A3 with a QX-314-filled micropipette. C, triggering of a low-threshold spike topped by a high-frequency AP burst at the offset of a square pulse of constant hyperpolarizing current. D1 and D2, five superimposed extracellular and intracellular traces of the same RTN neurone, respectively, which occur in phase with a spontaneous SW complex.
Figure 11
Figure 11. Intrinsic and synaptic features of the reticular depolarizing wave
A1-A3, SW-related RTN depolarizing events recorded about 9 min after impalement with a QX-314-filled micropipette: a barrage of EPSPs (left depolarizing events in A1, A2 and A3), an EPSP barrage triggering, in an all-or-none fashion, a high-threshold (right depolarization in A2) or low-threshold (right depolarization in A3) depolarizing spike. B1 and B2, typical individual reticular EPSPs (B1, curved arrow) and a barrage of similar EPSPs B2, curved arrow), which were recorded with a QX-314-filled micropipette before and during a SWD, respectively. Both records are at the same membrane potential (−53 mV, 0 nA). These depolarizing events and the records in A1-A3 are from the same neurone. B3, recorded in a TC cell with a QX-314-filled micropipette, a SW-related barrage of EPSPs triggers an apparent low-threshold Ca2+ spike (membrane potential: −76 mV). Curved arrows indicate individual EPSPs, which resemble individual EPSPs recorded in RTN cells (B1 and B2). C1 and C2, comparison of two typical recurring threshold depolarizing waves, which were recorded during high-voltage (C1) or medium-voltage (C2) 5–9 Hz ECoG oscillations with a KAc- (upper traces) or QX-314-filled (lower traces) micropipette. The asterisks in A2, A3, and in C1 indicate a late hyperpolarization that probably results from a Ca2+-activated K+ current. The APs are truncated in C1 and in C2 for clarity.
Figure 9
Figure 9. Reticular intracellular activity associated with spontaneously occurring epileptic (A) or normal (B) 5–9 Hz oscillations
The curved arrows indicate barrages of EPSPs. In A1, a current square pulse of −0.6 nA was delivered every 2 s (top record), and the grey area is expanded in A2. In B1, a current square pulse of −0.2 nA was delivered every 2 s. The recording traces in B1 and B2 are from two RTN cells. In A2 and B2, the arrowhead indicates the sudden occurrence of a prominent hyperpolarization that precedes a threshold large depolarizing wave. A3, B3, when relatively more hyperpolarized, the EPSP barrages are more evident. The horizontal dotted line indicates the AP threshold (−58 mV) at rest. The APs are clipped in A2 and 3, and in B2 and 3.
Figure 8
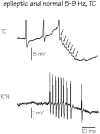
Figure 8. High-frequency AP bursts in RTN cells are responsible for the occurrence of barrage of IPSPs (arrows) in TC neurones
From top to bottom are shown: a typical individual threshold depolarizing wave-hyperpolarizing wave sequence recorded in a TC neurone (APs cut for clarity), and a typical extracellular RTN high-frequency burst of APs. Note that the acceleration-deceleration patterns of the IPSPs barrage and of the RTN burst are similar. The time scale bar is valid for both traces.
Figure 12
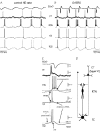
Figure 12. Summary of the reported data
Schematic diagram showing likely spatio-temporal cellular interactions within the TC system occurring during natural medium voltage 5–9 Hz oscillations in control non-epileptic rats (A) and during SWD in GAERS (B). In both NE rats and GAERS, at least two types of TC neurones coexist, of which one (TC2) is endowed with a presumed H-current. Note that thalamic, relay and reticular, discharges occur in much more synchronous and phase-locked manners during SWD than during natural 5–9 Hz oscillations. C, a mounting of SW-related extracellular CT and intracellular RTN and TC activities. From top to bottom: a SW complex (ECoG), an extracellular CT discharge, an intracellular RTN discharge, and two typical intracellular TC discharges. The second TC cell (TC2) exhibits a presumed H-current, coinciding with an EPSP barrage. The ramp-shaped depolarization, which includes a presumed Ih, can trigger a low-threshold Ca2+ spike (LTS). In RTN cells, the EPSP barrage can trigger voltage-dependent components (V-components). D, schematic drawing of the anatomical relationships between the three main elements that make up the TC system.

Similar articles

Cited by

References

    1. Andrade R. Blockade of neurotransmitter-activated K+ conductance by QX-314 in the rat hippocampus. Eur J Pharmacol. 1991;19:259–262. - PubMed
    1. Avanzini G, de Curtis M, Panzica F, Spreafico R. Intrinsic properties of nucleus reticularis thalami neurones of the rat studied in vitro. J Physiol. 1989;416:111–122. - PMC - PubMed
    1. Avoli M, Gloor P. Interaction of cortex and thalamus in spike and wave discharges of feline generalized penicillin epilepsy. Exp Neurol. 1982;76:196–217. - PubMed
    1. Bal T, Debay D, Destexhe A. Cortical feedback controls the frequency and synchrony of oscillations in the visual thalamus. J Neurosci. 2000;20:7478–7488. - PMC - PubMed
    1. Bal T, McCormick DA. Mechanisms of oscillatory activity in guinea-pig nucleus reticularis thalami in vitro: a mammalian pacemaker. J Physiol. 1993;468:669–691. - PMC - PubMed

Publication types

LinkOut - more resources