. 2003 Sep 2;100(18):10405-10.
doi: 10.1073/pnas.1533207100. Epub 2003 Aug 15.

Estrogen deficiency induces bone loss by increasing T cell proliferation and lifespan through IFN-gamma-induced class II transactivator

Affiliations

Estrogen deficiency induces bone loss by increasing T cell proliferation and lifespan through IFN-gamma-induced class II transactivator

Simone Cenci et al. Proc Natl Acad Sci U S A. .

Abstract

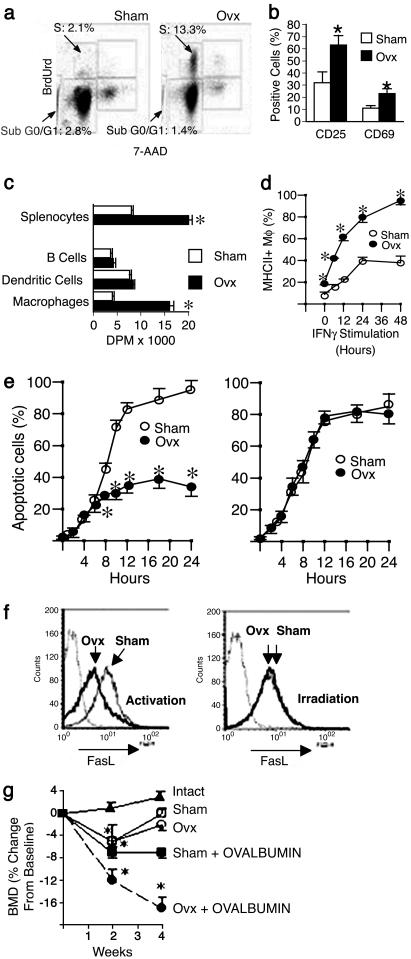
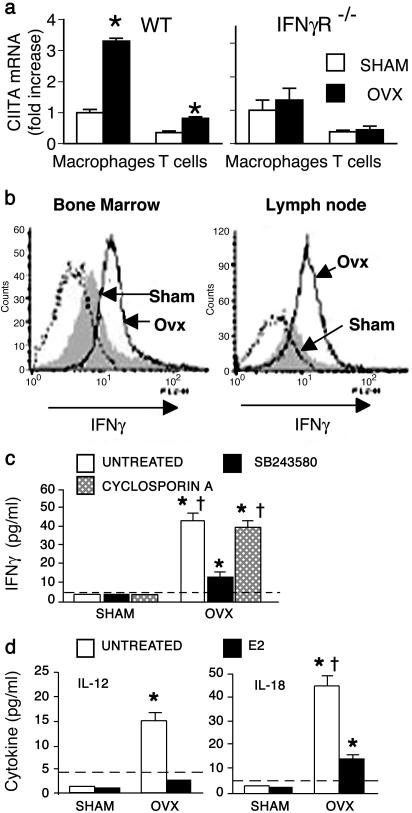
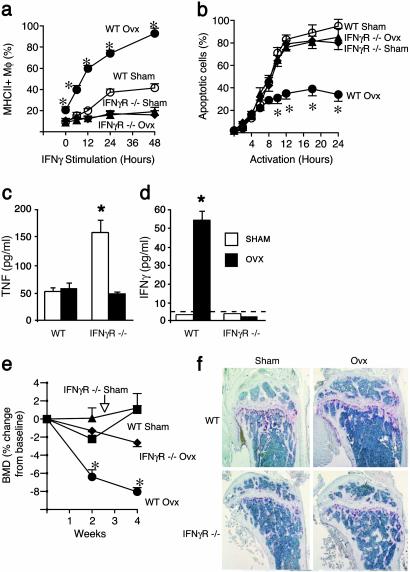
Expansion of the pool of tumor necrosis factor (TNF)-alpha-producing T cells is instrumental for the bone loss induced by estrogen deficiency, but the responsible mechanism is unknown. Here we show that ovariectomy up-regulates IFN-gamma-induced class II transactivator, a multitarget immune modulator, resulting in increased antigen presentation by macrophages, enhanced T cell activation, and prolonged lifespan of active T cells. Up-regulation of class II transactivator derives from increased production of IFN-gamma by T helper 1 cells, resulting from enhanced secretion of IL-12 and IL-18 by macrophages. The resulting T cell expansion and bone loss are prevented in vivo by both blockade of antigen presenting cell-induced T cell activation, and silencing of IFN-gamma receptor signaling. Thus, increased IFN-gamma-induced class II transactivator expression and the resulting enhanced T cell proliferation and lifespan are critical to the bone wasting effect of estrogen deficiency.


Figures

Fig. 1.
Fig. 1.
In vivo analysis of T cell proliferation, apoptosis, and Ag presentation in ovx mice. (a) Analysis of BrdUrd incorporation and total DNA content (7-amino-actinomycin, 7-AAD) in spleen CD3+ T cells from sham-operated mice (Left) and ovx mice (Right). Proliferation is indicated as percentage of T cells in S phase. Percentage of apoptotic T cells is represented by the population in SubG0/G1 phase. (b) FACS analysis of T cell activation in the bone marrow. Data are expressed as percentage (mean ± SEM) of CD3+ T cells expressing CD25 or CD69. (c) APC activity of spleen cells and purified subpopulations of professional APCs from sham and ovx mice, as assessed by incorporation of [3H]thymidine by target T cells (data expressed as mean ± SEM of disintegrations per minute). (d) FACS analysis of MHCII expression in peritoneal Mϕ from sham and ovx mice. Data are expressed as percentage (mean ± SEM) of Mϕ expressing MHCII. (e) FACS analysis of activation- and irradiation-induced apoptosis in spleen CD4+ T cells. Data are expressed as percentage (mean ± SEM) of live apoptotic cells assessed by binding of annexin V. (f) FACS analysis of activation- and irradiation-induced FasL expression in spleen CD4+ T cells. Isotype control is indicated by the dotted line. All data are representative of at least three independent experiments. *, P < 0.05 compared with the corresponding sham group. (g) In vivo role of Ag presentation in ovx-induced bone loss. Shown is the effect of ovx on femoral BMD of DO11.10 mice (n = 6 per group). Data are expressed as percentage change (mean ± SEM) from baseline. *, P < 0.05 compared with both baseline and intact mice.
Fig. 2.
Fig. 2.
Ovx increases IFN-γ-induced CIITA in APCs and T cells. (a) Reverse transcriptase real-time PCR analysis of CIITA mRNA levels in BM Mϕ and T cells from WT and IFN-γR-/- mice of identical genetic background. (b) FACS analysis of IFN-γ levels in gated CD4+ T cells in BM (Left), and lymph nodes (Right) from sham and ovx mice. Isotype control is indicated by the dotted line. (c) ELISA for IFN-γ concentration in culture supernatants of purified BM CD90+ T cells, unstimulated or treated with cyclosporin A or SB203580. Data are expressed as mean ± SEM of six replicates. *, P < 0.05 compared with all undetectable groups by Fisher exact test. †, P < 0.05 compared with ovx, SB203580-treated groups. The dashed line indicates assay detection threshold. (d) ELISA for IL-12 and IL-18 levels in culture supernatants of purified CD11b+ BM Mϕ, treated with 17β estradiol (E2) or left untreated. Data are expressed as mean ± SEM of six replicates. *, P < 0.05 compared with all undetectable groups by Fisher exact test. †, P < 0.05 compared with ovx, E2-treated groups. The dashed line indicates assay detection threshold. All data are representative of at least three independent experiments.
Fig. 3.
Fig. 3.
IFN-γR-/- mice are protected from ovx-induced immune alterations, T cell expansion, and bone loss. (a) Basal and IFN-γ-stimulated MHCII expression by Mϕ from sham and ovx WT and IFN-γR-/- mice. Data are expressed as percentage (mean ± SEM) of Mϕ expressing MHCII. (b) FACS analysis of AICD in TH cells from sham and ovx WT and IFN-γR-/- mice. Percentage (mean ± SEM) of live apoptotic cells assessed by binding of annexin V is shown. All data are representative of at least three independent experiments. (c and d) Levels of TNF and IFN-γ in supernatants from purified unstimulated TH cells from sham and ovx WT and IFN-γR-/- mice. Data are expressed as average (±SEM) of six replicate samples. *, P < 0.05 compared with all other groups. The dashed line indicates assay detection threshold. (e) Analysis of BMD in sham and ovx WT and IFN-γR-/- mice (n = 6 per group). Data are expressed as percentage change (mean ± SEM) from baseline. *, P < 0.05 compared with baseline. (f) Histology of proximal tibia of sham and ovx WT and IFN-γR-/- mice. Representative samples from one mouse per group are shown. WT ovx mice, but not IFN-γR-/- mice, exhibit decreased trabecular bone and increased tartrate-resistant acid phosphatase positive osteoclasts (red staining) as compared with sham controls.

References

    1. Riggs, B. L., Khosla, S. & Melton, L. J., III (2002) Endocr. Rev. 23, 279-302. - PubMed
    1. Kousteni, S., Chen, J. R., Bellido, T., Han, L., Ali, A. A., O'Brien, C. A., Plotkin, L., Fu, Q., Mancino, A. T., Wen, Y., et al. (2002) Science 298, 843-846. - PubMed
    1. Riggs, B. L. (2000) J. Clin. Invest. 106, 1203-1204. - PMC - PubMed
    1. Lam, J., Takeshita, S., Barker, J. E., Kanagawa, O., Ross, F. P. & Teitelbaum, S. L. (2000) J. Clin. Invest. 106, 1481-1488. - PMC - PubMed
    1. Pfeilschifter, J., Koditz, R., Pfohl, M. & Schatz, H. (2002) Endocr. Rev. 23, 90-119. - PubMed

Publication types