

The B cell receptor itself can activate complement to provide the complement receptor 1/2 ligand required to enhance B cell immune responses in vivo
- PMID: 12925675
- PMCID: PMC2194168
- DOI: 10.1084/jem.20022042
The B cell receptor itself can activate complement to provide the complement receptor 1/2 ligand required to enhance B cell immune responses in vivo
Abstract
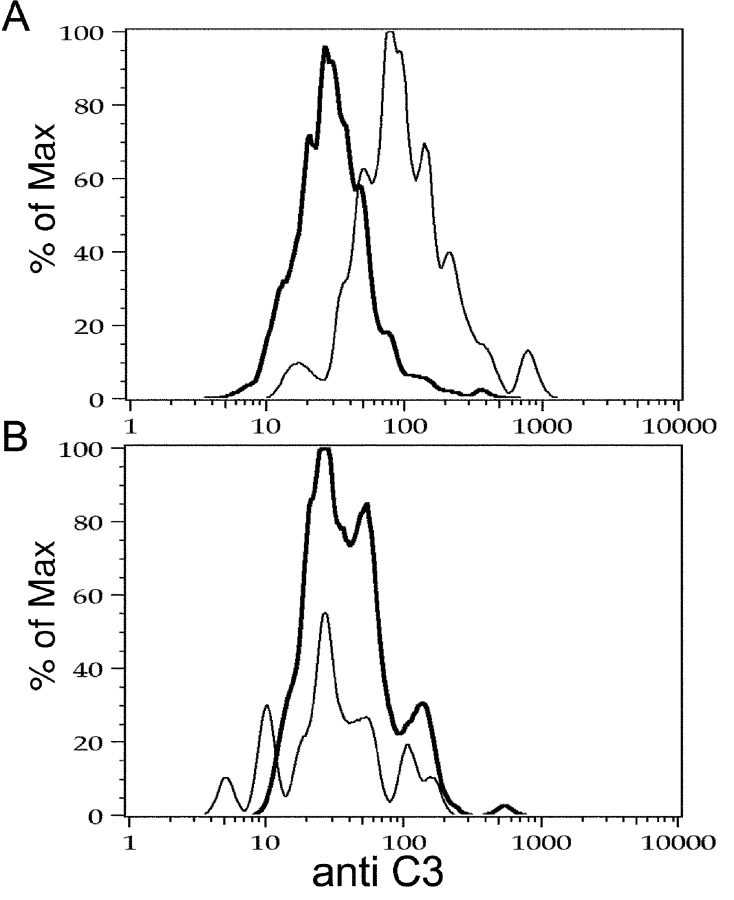
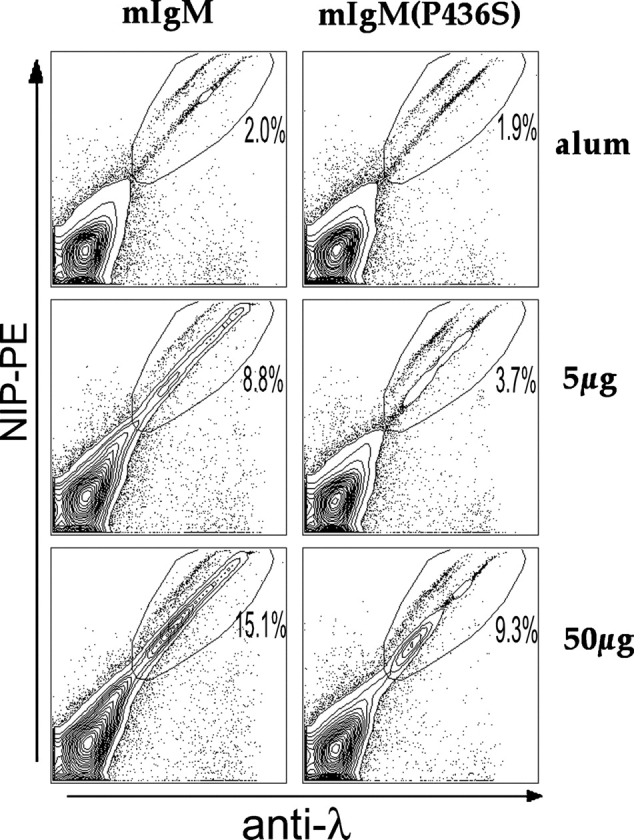
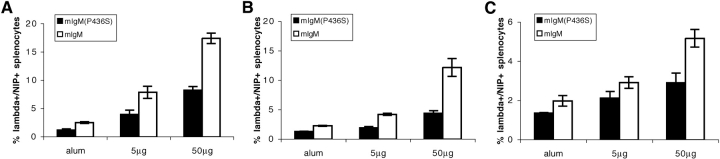
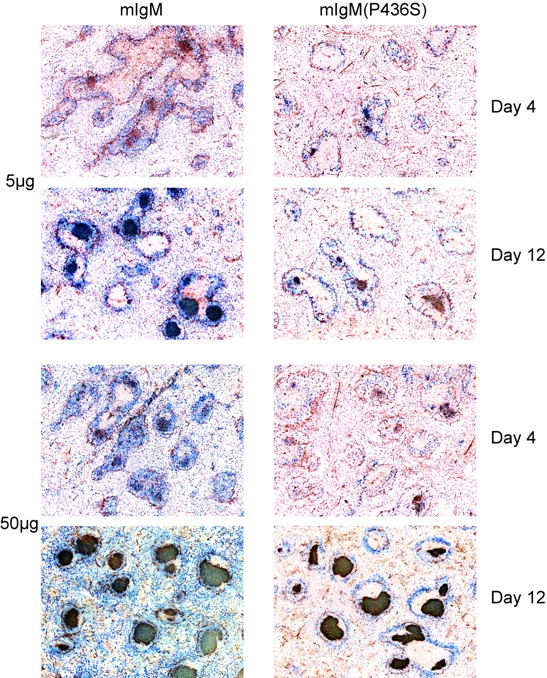
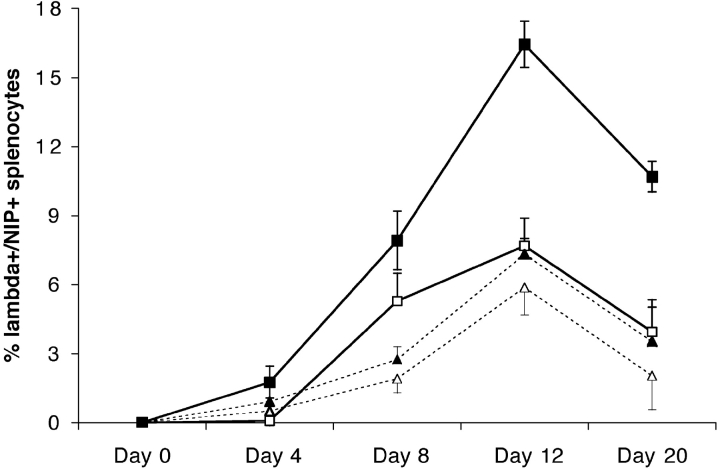
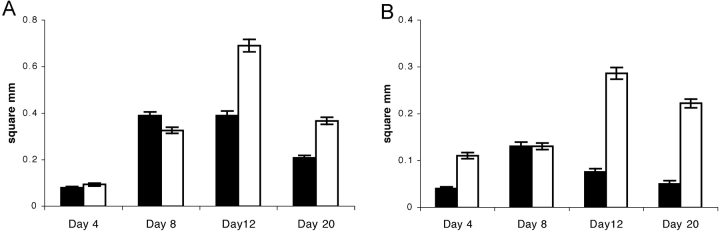
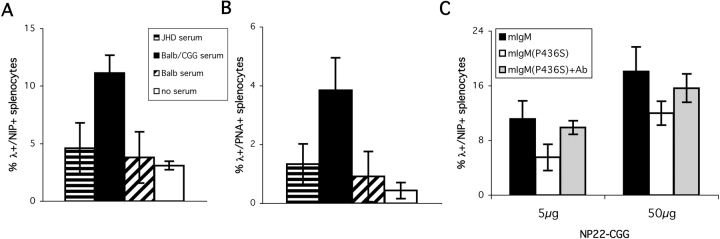
B cells express complement receptors (CRs) that bind activated fragments of C3 and C4. Immunized CR knockout (KO) mice have lower antibody titers and smaller germinal centers (GCs), demonstrating the importance of CR signals for the humoral immune response. CR ligands were thought to be generated via complement fixation mediated by preexisting "natural" IgM or early Ab from inefficiently activated B cells. This concept was recently challenged by a transgenic (Tg) mouse model that lacks circulating antibody but still retains membrane IgM (mIgM) and mounts normal immune responses. To test whether CR ligands could be generated by the B cell receptor (BCR) itself, we generated similar mice carrying a mutated mIgM that was defective in C1q binding. We found that B cells from such mutant mice do not deposit C3 on B cells upon BCR ligation, in contrast to B cells from mIgM mice. This has implications for the immune response: the mutant mice have smaller GCs than mIgM mice, and they are particularly deficient in the maintenance of the GC response. These results demonstrate a new BCR-dependent pathway that is sufficient and perhaps necessary to provide a CR1/2 ligand that promotes efficient B cell activation.
Figures
Similar articles
-
Antibody-independent B cell-intrinsic and -extrinsic roles for CD21/35.Eur J Immunol. 2006 Sep;36(9):2384-93. doi: 10.1002/eji.200636172. Eur J Immunol. 2006. PMID: 16906534
-
Dynamic regulation of B cell complement signaling is integral to germinal center responses.Nat Immunol. 2021 Jun;22(6):757-768. doi: 10.1038/s41590-021-00926-0. Epub 2021 May 24. Nat Immunol. 2021. PMID: 34031614 Free PMC article.
-
Marginal zone B cells transport and deposit IgM-containing immune complexes onto follicular dendritic cells.Int Immunol. 2004 Oct;16(10):1411-22. doi: 10.1093/intimm/dxh142. Epub 2004 Aug 23. Int Immunol. 2004. PMID: 15326094
-
The role of complement in B cell activation and tolerance.Adv Immunol. 2000;74:61-88. doi: 10.1016/s0065-2776(08)60908-6. Adv Immunol. 2000. PMID: 10605604 Review.
-
[Role of the complement C3 protein in the control of the specific immune response].Ann Biol Clin (Paris). 1999 Mar-Apr;57(2):127-35. Ann Biol Clin (Paris). 1999. PMID: 10210739 Review. French.
Cited by
-
Crohn's Disease Patients in Remission Display an Enhanced Intestinal IgM⁺ B Cell Count in Concert with a Strong Activation of the Intestinal Complement System.Cells. 2019 Jan 21;8(1):78. doi: 10.3390/cells8010078. Cells. 2019. PMID: 30669641 Free PMC article.
-
Requirement for complement in antibody responses is not explained by the classic pathway activator IgM.Proc Natl Acad Sci U S A. 2011 Oct 25;108(43):E934-42. doi: 10.1073/pnas.1109831108. Epub 2011 Oct 10. Proc Natl Acad Sci U S A. 2011. PMID: 21987785 Free PMC article.
-
PI3Kγ in B cells promotes antibody responses and generation of antibody-secreting cells.Nat Immunol. 2024 Aug;25(8):1422-1431. doi: 10.1038/s41590-024-01890-1. Epub 2024 Jul 3. Nat Immunol. 2024. PMID: 38961274
-
Defective B cell ontogeny and immune response in human complement receptor 2 (CR2, CD21) transgenic mice is partially recovered in the absence of C3.Mol Immunol. 2007 Jul;44(13):3434-44. doi: 10.1016/j.molimm.2007.02.011. Epub 2007 Mar 26. Mol Immunol. 2007. PMID: 17379312 Free PMC article.
-
The role of the complement system in kidney glomerular capillary thrombosis.Front Immunol. 2022 Sep 14;13:981375. doi: 10.3389/fimmu.2022.981375. eCollection 2022. Front Immunol. 2022. PMID: 36189215 Free PMC article. Review.
References
-
- Carter, R.H., M.O. Spycher, Y.C. Ng, R. Hoffman, and D.T. Fearon. 1988. Synergistic interaction between complement receptor type 2 and membrane IgM on B lymphocytes. J. Immunol. 141:457–463. - PubMed
-
- Pepys, M.B. 1972. Role of complement in induction of the allergic response. Nat. New Biol. 237:157–159. - PubMed
-
- Chen, Z., S.B. Koralov, M. Gendelman, M.C. Carroll, and G. Kelsoe. 2000. Humoral immune responses in Cr2−/− mice: enhanced affinity maturation but impaired antibody persistence. J. Immunol. 164:4522–4532. - PubMed
Publication types
MeSH terms
Substances
Grants and funding
LinkOut - more resources
Full Text Sources
Other Literature Sources
Molecular Biology Databases
Research Materials
Miscellaneous
