. 2003 Aug;112(4):566-74.
doi: 10.1172/JCI17265.

Beta-arrestin-2 regulates the development of allergic asthma

Affiliations

Beta-arrestin-2 regulates the development of allergic asthma

Julia K L Walker et al. J Clin Invest. 2003 Aug.

Abstract

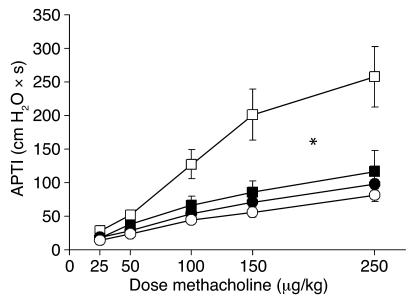
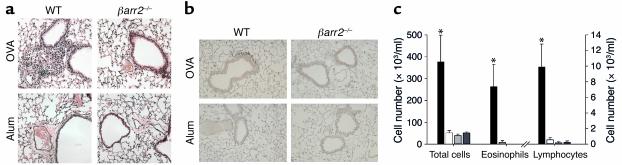
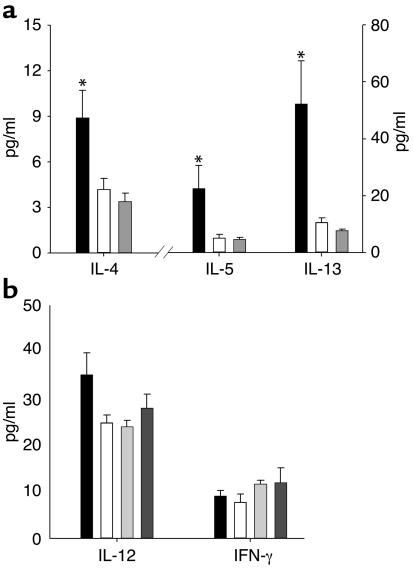
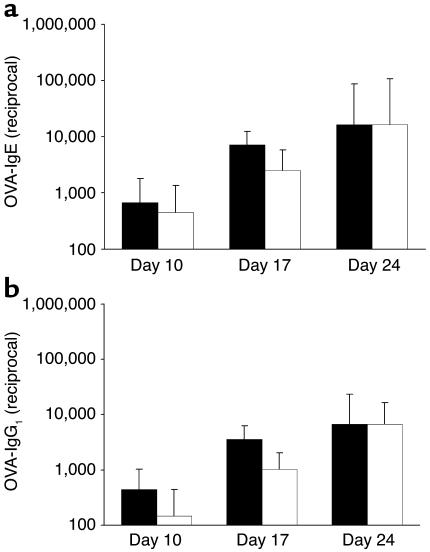
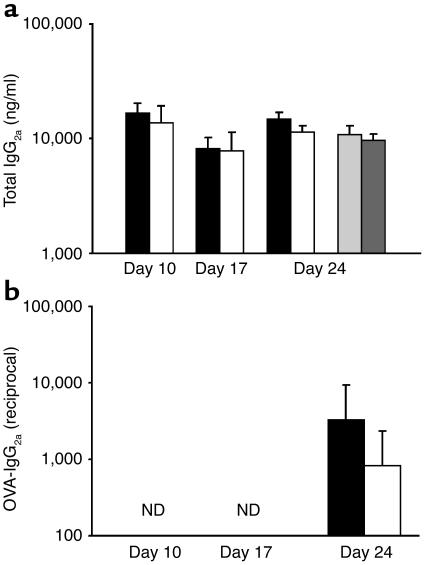
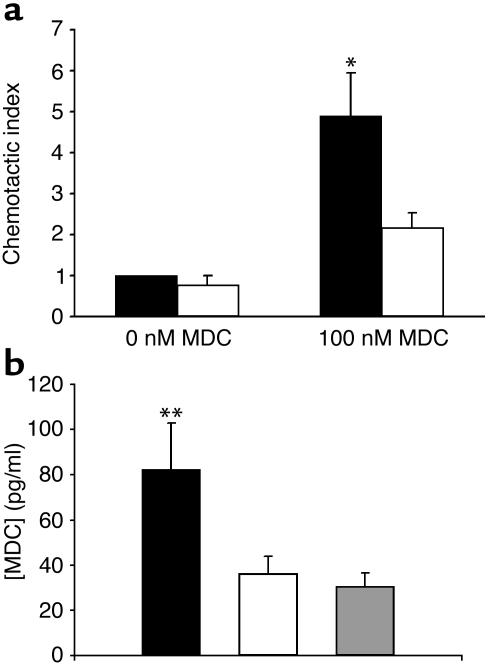
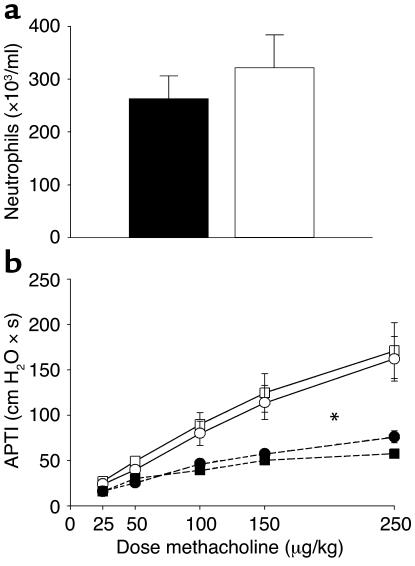
Asthma is a chronic inflammatory disorder of the airways that is coordinated by Th2 cells in both human asthmatics and animal models of allergic asthma. Migration of Th2 cells to the lung is key to their inflammatory function and is regulated in large part by chemokine receptors, members of the seven-membrane-spanning receptor family. It has been reported recently that T cells lacking beta-arrestin-2, a G protein-coupled receptor regulatory protein, demonstrate impaired migration in vitro. Here we show that allergen-sensitized mice having a targeted deletion of the beta-arrestin-2 gene do not accumulate T lymphocytes in their airways, nor do they demonstrate other physiological and inflammatory features characteristic of asthma. In contrast, the airway inflammatory response to LPS, an event not coordinated by Th2 cells, is fully functional in mice lacking beta-arrestin-2. beta-arrestin-2-deficient mice demonstrate OVA-specific IgE responses, but have defective macrophage-derived chemokine-mediated CD4+ T cell migration to the lung. This report provides the first evidence that beta-arrestin-2 is required for the manifestation of allergic asthma. Because beta-arrestin-2 regulates the development of allergic inflammation at a proximal step in the inflammatory cascade, novel therapies focused on this protein may prove useful in the treatment of asthma.


Figures

Figure 1
Figure 1
Effect of OVA treatment on airway responsiveness. Airway responsiveness to methacholine, defined by the time-integrated change in peak airway pressure, or airway pressure time index (APTI), was measured for βarr2–/– (circles) and WT (squares) mice treated with either alum (filled symbols) or OVA (open symbols). Data are mean ± SEM; n = 9–12 mice per group. *Effect of OVA treatment was significantly different between WT and βarr2–/– mice. P < 0.05.
Figure 2
Figure 2
Effect of OVA treatment on airway inflammation. (a) Effect of genotype and OVA treatment on lung inflammation evaluated by histological analysis of lung sections. Lung sections from WT-alum (lower left) and βarr2–/–-alum mice (lower right) appeared normal with no inflammatory cell infiltration. Lung sections from WT-OVA mice (upper left) showed severe cellular infiltration in the interstitium. Lung sections from βarr2–/–-OVA mice (upper right) showed mild extravasation of inflammatory cells in the interstitium. Representative histological sections are shown (n = 8–11 mice per group). (b) Representative images of cross-sectioned airways together with peribronchovascular connective tissue are shown. CD3+ T cells were counted in the subtended bronchovascular interstitium. OVA-treated WT mice showed an increased number of CD3+ T cells in the peribronchovascular zone relative to alum-treated mice. No such infiltration of CD3+ T cells was observed in OVA-treated βarr2–/– mice. (c) Effect of genotype and OVA treatment on lung inflammation assessed by identification of cells harvested from whole-lung lavage. Black bars represent WT-OVA mice; white bars represent βarr2–/–-OVA mice; light gray bars represent WT-alum mice; dark gray bars represent βarr2–/–-alum mice. Data are mean ± SEM; n = 9–12 mice per group. *P < 0.05 versus all other groups.
Figure 3
Figure 3
Effect of genotype and OVA treatment on lung cytokine release in whole-lung lavage fluid. (a) Cytokines associated with a Th2-type response were significantly elevated in WT-OVA mice relative to βarr2–/–-OVA mice and alum-treated mice of either genotype. Black bars represent WT-OVA mice; white bars represent βarr2–/–-OVA mice. Cytokine levels in alum-treated WT and alum-treated βarr2–/– mice were not different and therefore were combined as shown by gray bars. Data are mean ± SEM calculated from three independent experiments; n = 11–19 mice per group. *P < 0.05 versus all other groups. (b) Cytokines associated with a Th1-type response were not significantly elevated by OVA treatment and were similar for WT and βarr2–/– mice. Black bars represent WT-OVA mice; white bars represent βarr2–/–-OVA mice. Light gray bars represent alum-treated WT mice; dark gray bars represent βarr2–/– mice. Data are mean ± SEM calculated from two to three independent experiments; n = 7–13 mice per group.
Figure 4
Figure 4
Effect of OVA treatment on serum Ig production. Although OVA-specific IgE (a) and IgG1 (b) levels changed significantly over time, serum Ig levels in WT-OVA mice (black bars) were not significantly different from those in βarr2–/–-OVA mice (white bars) when compared at each timepoint (days 10, 17, and 24). These OVA-specific Ig’s were not detected in alum-treated mice of either genotype. Measurements were made using the endpoint titer method. Data are mean ± SD calculated from two independent experiments; n = 3–8 mice per group. One-way ANOVA and the Tukey HSD post-hoc test were used.
Figure 5
Figure 5
IgG2a production. (a) Total serum IgG2a levels were not different between WT-OVA mice (black bars) and βarr2–/–-OVA mice (white bars) at day 10, 17, or 24. Similarly, there was no difference in IgG2a levels in serum from alum-treated WT (light gray bars) and alum-treated βarr2–/– mice (dark gray bars). Data are mean ± SEM calculated from three independent experiments; n = 4–14 mice per group. (b) OVA-specific IgG2a measurements were not different between WT-OVA mice (black bars) and βarr2–/–-OVA mice (white bars) at day 24. Measurements were made using the endpoint titer method. Data are mean ± SD calculated from two experiments; n = 3 mice per group. ND, non-detectable.
Figure 6
Figure 6
Chemotactic responses to MDC and release of MDC in lavage fluid. (a) Lung CD4+ T cells from OVA-treated βarr2–/– mice (white bars) exhibit decreased migration toward MDC. CD4+ T cells were isolated on day 24 of the OVA treatment protocol and tested for their ability to move chemotactically toward 100 nM MDC. Shown is the mean chemotactic index and SE from three independent experiments. *P < 0.05 vs. βarr2–/–-OVA mice. (b) Release of MDC into whole-lung lavage fluid was significantly induced in OVA-treated WT mice (black bars) but not OVA-treated βarr2–/– mice (white bars). MDC levels in alum-treated WT and alum-treated βarr2–/– mice were not different and therefore were combined (gray bars). Data are mean ± SEM calculated from two independent experiments; n = 9 mice per group. **P < 0.05 versus combined alum-treated mice.
Figure 7
Figure 7
Effect of LPS treatment on airway responsiveness and inflammation. (a) Effect of genotype and LPS treatment on lung inflammation assessed by identification of cells harvested from whole-lung lavage. Black bars represent WT LPS-treated mice; white bars represent βarr2–/– LPS-treated mice. Data are mean ± SEM; n = 13–15 mice per group. (b) Airway responsiveness to methacholine, defined by the time-integrated change in peak airway pressure was measured for βarr2–/– (circles) and WT (squares) mice treated with LPS (open symbols) or untreated (filled symbols). Data are mean ± SEM; n = 13–15 mice per group. *LPS treatment caused a similar significant increase in APTI in WT and βarr2–/– mice. P < 0.05.

References

    1. Wills-Karp M. Immunologic basis of antigen-induced airway hyperresponsiveness. Annu. Rev. Immunol. 1999;17:255–281. - PubMed
    1. Ray A, Cohn L. Th2 cells and GATA-3 in asthma: new insights into the regulation of airway inflammation. J. Clin. Invest. 1999;104:985–993. - PMC - PubMed
    1. National Institutes of Health. 1995. Data fact sheet: asthma statistics. Report number 55–798. National Heart Lung and Blood Institute. Washington, DC, USA. 1–4.
    1. Sallusto F, Mackay CR, Lanzavecchia A. The role of chemokine receptors in primary, effector, and memory immune responses. Annu. Rev. Immunol. 2000;18:593–620. - PubMed
    1. Lloyd C. Chemokines in allergic lung inflammation. Immunology. 2002;105:144–154. - PMC - PubMed

Publication types

MeSH terms