. 2003 Aug;112(4):608-18.
doi: 10.1172/JCI17305.

Muscle-specific PPARgamma-deficient mice develop increased adiposity and insulin resistance but respond to thiazolidinediones

Affiliations

Muscle-specific PPARgamma-deficient mice develop increased adiposity and insulin resistance but respond to thiazolidinediones

Andrew W Norris et al. J Clin Invest. 2003 Aug.

Abstract

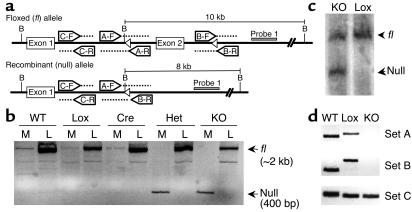
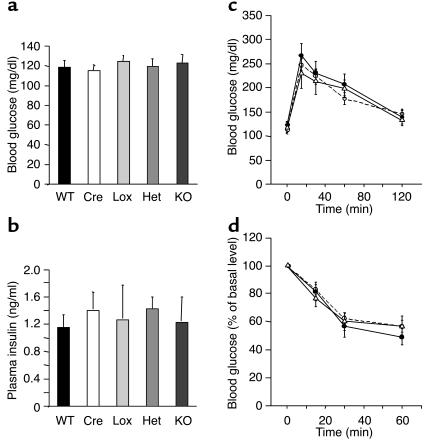
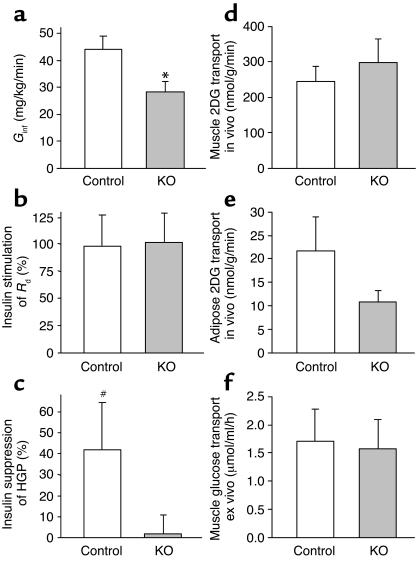
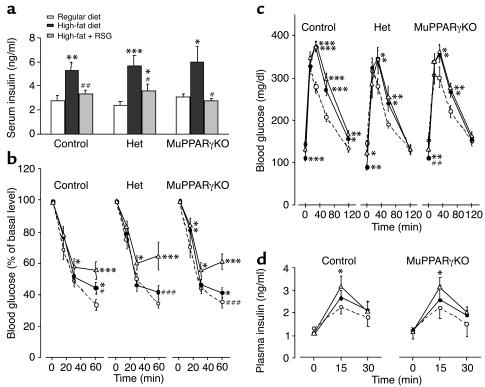
Activation of peroxisome proliferator-activated receptor gamma (PPARgamma) by thiazolidinediones (TZDs) improves insulin resistance by increasing insulin-stimulated glucose disposal in skeletal muscle. It remains debatable whether the effect of TZDs on muscle is direct or indirect via adipose tissue. We therefore generated mice with muscle-specific PPARgamma knockout (MuPPARgammaKO) using Cre/loxP recombination. Interestingly, MuPPARgammaKO mice developed excess adiposity despite reduced dietary intake. Although insulin-stimulated glucose uptake in muscle was not impaired, MuPPARgammaKO mice had whole-body insulin resistance with a 36% reduction (P < 0.05) in the glucose infusion rate required to maintain euglycemia during hyperinsulinemic clamp, primarily due to dramatic impairment in hepatic insulin action. When placed on a high-fat diet, MuPPARgammaKO mice developed hyperinsulinemia and impaired glucose homeostasis identical to controls. Simultaneous treatment with TZD ameliorated these high fat-induced defects in MuPPARgammaKO mice to a degree identical to controls. There was also altered expression of several lipid metabolism genes in the muscle of MuPPARgammaKO mice. Thus, muscle PPARgamma is not required for the antidiabetic effects of TZDs, but has a hitherto unsuspected role for maintenance of normal adiposity, whole-body insulin sensitivity, and hepatic insulin action. The tissue crosstalk mediating these effects is perhaps due to altered lipid metabolism in muscle.


Figures

Figure 1
Figure 1
Recombination of PPARγ-loxP allele in the muscle of MuPPARγKO mice. (a) Schematic of recombinant mouse PPARγ alleles indicating PCR primers sets, BamHI restriction sites (labeled as B), loxP sites (open triangles), and Probe 1 for Southern blot analysis. (b) Detection of intact (fl) versus recombined (null) allele by PCR on genomic DNA from muscle (M) or liver (L). The fl and null alleles appear at approximately 2 kb and 400 bp, respectively. (c) Southern blot analysis of BamHI-digested genomic DNA isolated from muscle samples from Lox and MuPPARγKO (KO) mice. Hybridization was performed with Probe 1, identifying fragments of 10 and 8 kb for fl and null alleles, respectively. (d) PCR detection of unrecombined alleles (primer sets A and B) or any WT, fl, or null allele (primer set C) in genomic DNA isolated from enriched myocytes of WT, Lox, and KO mice. Primer sets A and B yield larger products in the fl compared with WT allele due to loxP insertion.
Figure 2
Figure 2
Excess adiposity in MuPPARγKO mice exacerbated by high-fat diet. (a) Body mass of male mice on normal diet: WT (open squares), Cre (open diamonds), Lox (open triangles), Het (shaded circles), and MuPPARγKO (filled triangle). (b) Epididymal fat pad mass of 4-month-old mice fed normal diet. (c) Body mass of male mice following switch from normal to high-fat diet at 4 months of age: Lox (open triangles) and MuPPARγKO (filled triangles). (d) Whole-body triglyceride content of mice following 7 weeks of high-fat diet initiated at 4 months of age. (e) Daily intake of food per male mouse measured during weeks 3–7 following switch from normal to high-fat diet at 4 months of age. *P < 0.05 versus control; #P < 0.01 versus control.
Figure 3
Figure 3
MuPPARγKO mice have normal glucose and insulin levels, as well as normal response to glucose or insulin challenge. (a) Random-fed blood glucose of 4-month-old male mice. (b) Random-fed insulin levels of 4-month-old male mice. (c) GTT (2 g glucose/kg, intraperitoneal) of 4-month-old male mice after overnight fast. Control mice (includes WT, Cre, and Lox: open circles); Het (filled circles); KO (open triangles). (d) ITT (1 U insulin/kg, intraperitoneally) of 4-month-old male mice. Control mice (includes WT, Cre, and Lox: open circles); Het (filled circles); KO (open triangles).
Figure 4
Figure 4
Whole-body insulin resistance due to impaired insulin action in liver not skeletal muscle. (a) Glucose infusion rate (Ginf) required to maintain euglycemia during hyperinsulinemic clamp in 4-month-old male MuPPARγKO and control (Lox) mice. (b) Insulin stimulated increase in the Rd during hyperinsulinemic compared with basal portion of clamp. (c) Insulin stimulated the percentage suppression of HGP during hyperinsulinemic compared with basal portion of the clamp. Insulin stimulated 2-[14C]DG (2DG) uptake in vivo during hyperinsulinemic-euglycemic clamp in 4-month-old male MuPPARγKO and control (Lox) mice, in mixed hindquarter muscle (d), or in adipose tissue (e). (f) Insulin stimulated 2-[3H]DG uptake above basal in soleus muscle isolated ex vivo from MuPPARγKO and control (Lox) male mice fed a high-fat diet initiated at 4 months of age for 7 weeks. *P < 0.05 versus control; #P < 0.05 versus null hypothesis of no suppression.
Figure 5
Figure 5
RSG improves glucose homeostasis in MuPPARγKO mice fed a high-fat diet. (a) Random-fed insulin levels after 2 weeks of regular diet, high-fat diet, or high-fat diet plus RSG, in control, Het, and MuPPARγKO mice. (b) ITT (1.5 U/kg, intraperitoneally) of mice treated with regular diet, high-fat diet, or high-fat diet plus RSG for 4 weeks. (c) GTT (2 g/kg, intraperitoneally) after overnight fast. (d) Serum insulin concentrations during GTT. Groups: regular diet (open circles), high-fat diet (open triangles), and high-fat diet plus RSG (filled circles). *P < 0.05 versus regular diet; **P < 0.01 versus regular diet; ***P < 0.001 versus regular diet; #P < 0.05 versus high-fat diet; ##P < 0.01 versus high-fat diet; ###P < 0.001 versus high-fat diet.
Figure 6
Figure 6
Expression of lipid metabolism genes in skeletal muscle of MuPPARγKO mice. (a) Expression of lipid metabolism genes calculated from the average of three microarrays for six mice for each genotype. The data are presented as the ratio of intensity between MuPPARγKO and Lox mice. Standard errors were estimated using the zero method, for the purpose of display only. (b) Northern blot of RNA extracted from hindlimb muscles. *Statistically altered genes as determined by screening criteria detailed in Methods. #P < 0.05 versus control, based on Northern blot analysis.

Similar articles

Cited by

References

    1. Martin BC, et al. Role of glucose and insulin resistance in development of type 2 diabetes mellitus: results of a 25-year follow-up study. Lancet. 1992;340:925–929. - PubMed
    1. Lillioja S, et al. Insulin resistance and insulin secretory dysfunction as precursors of non-insulin-dependent diabetes mellitus: prospective studies of Pima Indians. N. Engl. J. Med. 1993;329:1988–1992. - PubMed
    1. DeFronzo RA, et al. The effect of insulin on the disposal of intravenous glucose: results from indirect calorimetry and hepatic and femoral venous catheterization. Diabetes. 1981;30:1000–1007. - PubMed
    1. Veroni MC, Proietto J, Larkins RG. Evolution of insulin resistance in New Zealand obese mice. Diabetes. 1991;40:1480–1487. - PubMed
    1. Petersen KF, et al. Mechanism of troglitazone action in type 2 diabetes. Diabetes. 2000;49:827–831. - PubMed

Publication types

MeSH terms