. 2003 Aug;14(8):3144-55.
doi: 10.1091/mbc.e03-04-0212. Epub 2003 May 3.

Subcellular localization of LGN during mitosis: evidence for its cortical localization in mitotic cell culture systems and its requirement for normal cell cycle progression

Affiliations

Subcellular localization of LGN during mitosis: evidence for its cortical localization in mitotic cell culture systems and its requirement for normal cell cycle progression

Rachna Kaushik et al. Mol Biol Cell. 2003 Aug.

Abstract

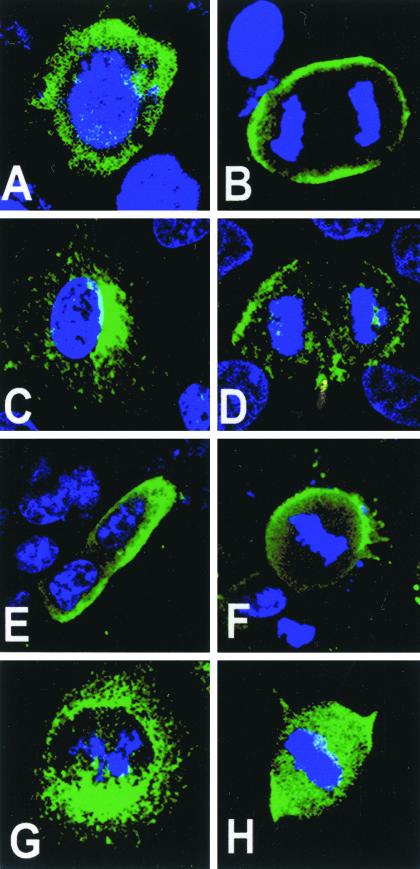
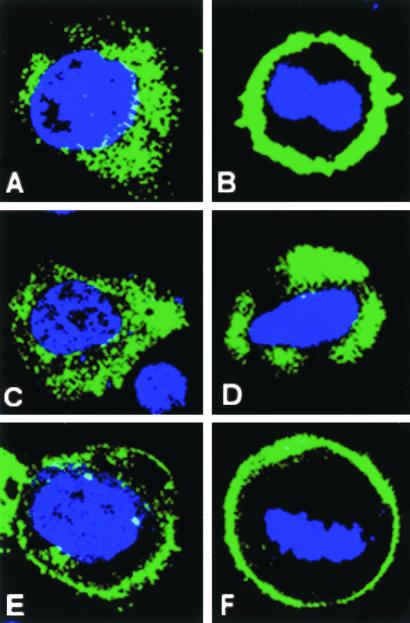
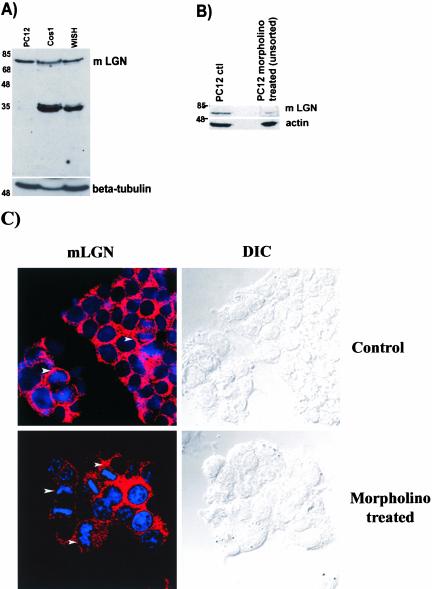
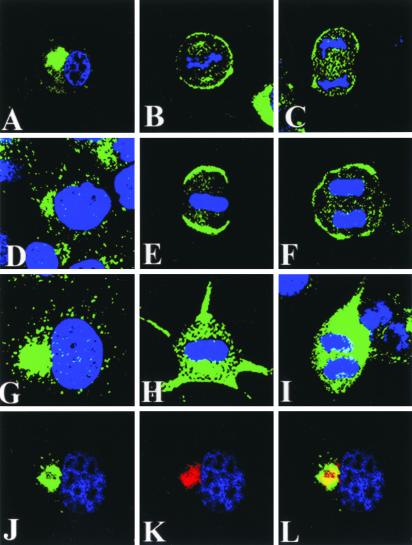
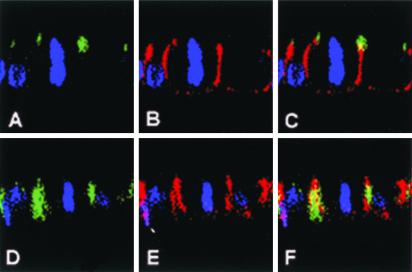
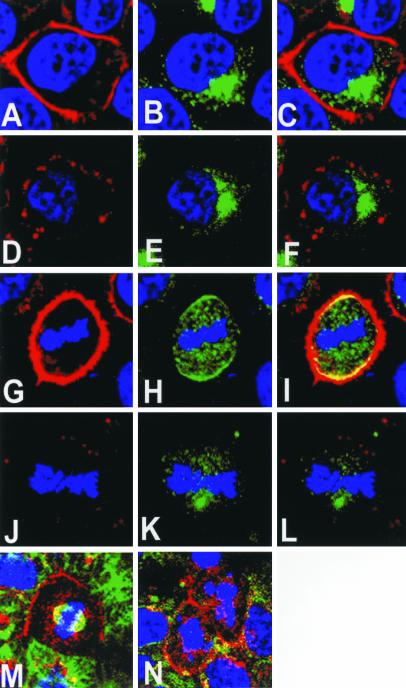
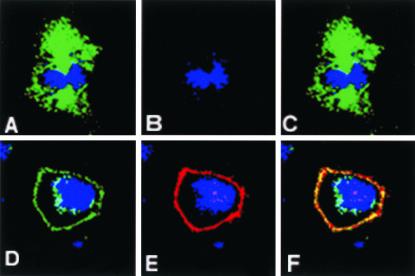
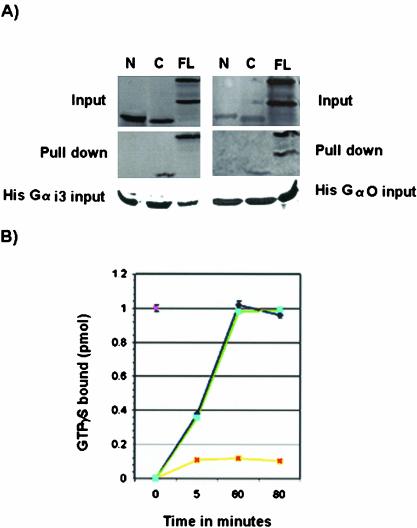
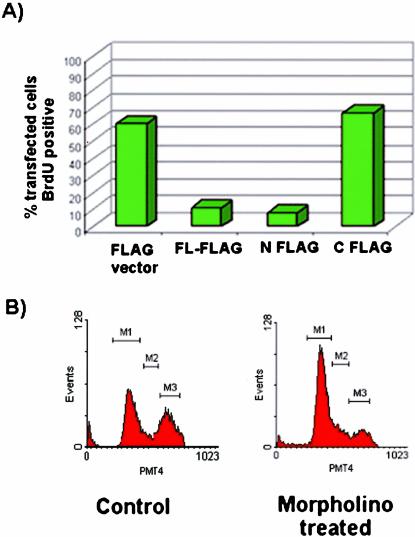
Mammalian LGN/AGS3 proteins and their Drosophila Pins orthologue are cytoplasmic regulators of G-protein signaling. In Drosophila, Pins localizes to the lateral cortex of polarized epithelial cells and to the apical cortex of neuroblasts where it plays important roles in their asymmetric division. Using overexpression studies in different cell line systems, we demonstrate here that, like Drosophila Pins, LGN can exhibit enriched localization at the cell cortex, depending on the cell cycle and the culture system used. We find that in WISH, PC12, and NRK but not COS cells, LGN is largely directed to the cell cortex during mitosis. Overexpression of truncated protein domains further identified the Galpha-binding C-terminal portion of LGN as a sufficient domain for cortical localization in cell culture. In mitotic COS cells that normally do not exhibit cortical LGN localization, LGN is redirected to the cell cortex upon overexpression of Galpha subunits of heterotrimeric G-proteins. The results also show that the cortical localization of LGN is dependent on microfilaments and that interfering with LGN function in cultured cell lines causes early disruption to cell cycle progression.


Figures

Figure 1.
Figure 1.
Overexpression and localization of exogenous LGN-FLAG in cell lines. LGN-FLAG was overexpressed in WISH (A and B), NRK (C and D), PC12 (E and F), and COS (G and H) cells. LGN localization was detected with anti-FLAG (green) and DNA was stained with TOPRO3 (blue). (A, C, E, and G) Interphase cells; (B, D, F, and H) mitotic cells. WISH, NRK, and PC12 cells localize LGN-FLAG to the perinucleus/cytoplasm in interphase and to the cell cortex during mitosis. In mitotic COS, LGN remains cytoplasmic (H).
Figure 2.
Figure 2.
Domain dissection of LGN. FLAG-tagged LGN constructs were transfected into WISH cells, and their subcellular localization was detected using anti-FLAG antibody (green). (A) Perinuclear/cytoplasmic staining for FL-LGN at interphase; (B) a cortical localization for FL-LGN at metaphase. N-FLAG (amino acids 1–384) remains mainly in the cytoplasm during interphase (C) and metaphase (D). C-FLAG (amino acids 385–672) is enriched at the cell cortex during both interphase (E) and metaphase (F). Residual cytoplasmic/perinuclear staining for C-FLAG can also be seen at interphase (E). The cell cycle stage was determined by DNA staining (blue).
Figure 3.
Figure 3.
Immunoblot analysis. Total protein extracts, 100 μg, were loaded in each lane and immunoblotted. (A) Protein extracts from PC12, COS, and WISH cell lines were probed with anti-LGN antibody at a concentration of 1 μg/ml. Anti-LGN detects a prominent band of the expected LGN molecular weight in the PC12 extract. COS and WISH cell extracts show the LGN band and other additional lower size bands. β-Tubulin is used as a protein-loading marker. (B) An immunoblot of PC12 cell extracts before and after morpholino treatment. The intensity of the LGN band is reduced fivefold upon morpholino treatment compared with that of the control untreated PC12 cells. In this immunoblot, actin was used as a protein-loading marker. (C) Confocal and DIC images of control and morpholino-treated PC12 cells stained with anti-LGN (red) and DNA (blue). Arrowheads indicate cells in mitosis showing cortical LGN staining in control cells but not in the morpholino-treated cells.
Figure 4.
Figure 4.
Subcellular localization of endogenous LGN in cell lines. Confocal images of PC12 (A–C), WISH (d–F), and COS cells (G–L) stained for LGN (green) and DNA (blue) are shown. In all cell lines, LGN localizes to a perinuclear space during interphase (A, D, G, and J). Colocalization in interphase COS cells between LGN (J; green) and Vti1α Golgi marker (K; red) is shown in L (yellow). Note the cortical localization of LGN during mitosis is only observed in PC12 (B and C) and WISH (E and F) but not COS (H and I) cells. In metaphase (H) and anaphase (I) COS cells, LGN remains in the cytoplasm. Some cytoplasmic staining of LGN can also be seen in mitotic PC12 (B and C) and WISH (E and F) cells.
Figure 5.
Figure 5.
Cortical subdomain localization of LGN in polarized MDCK cells. Confocal vertical optical sections (X-Z axis) of polarized MDCK cells at metaphase are shown.(A–C) A metaphase MDCK cell double stained for apical membrane marker ZO-1 (A; green) and β-catenin basolateral membrane marker (B; red). There is little overlap between the two membrane markers (C; yellow). (d--F) A metaphase MDCK cell double stained for LGN (D; green) and β-catenin (E; red). LGN and β-catenin show colocalization at the lateral membrane subdomain (F; yellow). The cell cycle stage was determined by DNA staining (blue).
Figure 6.
Figure 6.
Effects of cytoskeleton on LGN cortical localization. (A–L) Confocal images of cycling WISH cells stained with phalloidin (red), LGN (green), and DNA (blue); (A–C) a control interphase cell with LGN localizing at the perinuclear region (B, green) and actin microfilaments at the cell cortex (A, red); (C) a merged image of A and B; (D) the loss of cortical actin microfilaments upon latrunculin treatment, but the perinuclear LGN staining (E) remains unaffected in the drug-treated cell. (F) A merged image of D and E; (I) a merged image of G (phalloidin) and H (LGN) showing areas of overlap (yellow) between cortical actin and LGN in a control metaphase cell; note that some LGN staining in the cytoplasm is also visible at this stage. (J–L) A metaphase cell treated with latrunculin B; note the cytoplasmic staining of LGN (K) and the absence of phalloidin staining in the treated cell (J); (L) a merged image of J and K. (M and N) Metaphase WISH cells without (M) or with (N) colchicine treatment and stained for LGN (red), tubulin (green), and DNA (blue); note the absence of spindle staining in the treated cell, but no effect on LGN cortical staining (N).
Figure 7.
Figure 7.
Effects of Gαo on LGN cortical localization. (A–F) Confocal images of COS cells stained for LGN (green) and Gao (red). (A–C) A control metaphase COS cell with cytoplasmic LGN (A) and no Gαo expression (B); (C) a merged image of A and B. (d--F) A COS cell transfected with Gαo; LGN (D) and exogenous Gαo (E) are directed to the cell cortex of the transfected COS cell; note that a residual perinuclear staining for LGN can still be seen in this experiment; (F) a merged image of D and E showing areas of overlap (yellow) between Gαo and LGN. In all images, DNA staining is in blue.
Figure 8.
Figure 8.
GDI activity of mouse LGN. (A) Binding of mouse LGN to Gα subunits of heterotrimeric G-proteins. In vitro–translated LGN constructs containing amino acids 1–384 from the N-terminus (N), amino acids 385–670 from the C termini (C), or full length (FL) were incubated with His-Gαi3 or His-Gαo bound to His columns. Only FL and C products copurify with His-Gαi3/o. No binding is detected between construct N and Gαi3 or Gαo. In the FL lane, two bands are detected, an upper band corresponding to LGN and a lower band being a byproduct of the translation reaction. (B) GDI activity of mouse LGN on Gαi3. Time course experiments showing the rate of [35S]GTPγ binding by Gαi3 were carried out in the presence of 1 μM GST-LGN (yellow). Control experiments using GST alone are shown in blue. GST-LGN inhibits ∼90% of [35S]GTPγ binding to Gαi3 but the GST control has no effect. The effect of LGN on Gαi3 activity is observed as early as 5 min and lasts >80-min time period. GST-LGN effect on Gαo (green) is similar to the GST control (blue), indicating mouse LGN has no GDI activity on Gαo.
Figure 9.
Figure 9.
Effects of LGN on cell cycle progression. (A) Effect of ectopic expression of various mouse LGN constructs, FL-FLAG, N-FLAG, and C-FLAG on cell cycle in PC12 cells. Anti-BrdU and anti-FLAG antibodies were used for detection purposes. The bars represent percentage of BrdU-positive cells. The majority of FL-FLAG– or N-FLAG–transfected cells were BrdU-negative, whereas C-FLAG– or FLAG-vector–transfected cells were BrdU-positive, indicating that overexpression of either FL or N-FLAG but not C-FLAG results in cell cycle arrest. (B) Effect of LGN removal by morpholino treatment on cell cycle in PC12 cells. For control cells, the percentage of cells in G1 phase (M1) was ∼52%, S phase (M2) ∼11%, and G2 phase (M3) ∼37%. For morpholino-treated cells, the scores were ∼70% for M1, ∼10% for M2, and ∼21% for M3, indicating that the loss of LGN causes partial delay/disruption of the cell cycle progression at the G1/S phase boundary.

Similar articles

Cited by

References

    1. Antonin, W., Riedel, D., and von Mollard, G.F. (2000). The SNARE Vti1a-β is localized to small synaptic vesicles and participates in a novel SNARE complex. J. Neurosci. 20, 5724–5732. - PMC - PubMed
    1. Bernard, M.L., Peterson, Y.K., Chung, P., Jourdan, J., and Lanier, S.M. (2001). Selective interaction of AGS3 with G-proteins and the influence of AGS3 on the activation state of G-proteins. J. Biol. Chem. 276, 1585–1593. - PubMed
    1. Blatch, G.L., and Lassle, M. (1999). The tetratricopeptide repeat: a structural motif mediating protein-protein interactions. Bioessays 21, 932–939. - PubMed
    1. Blumer, J.B., Chandler, L.J., and Lanier, S.M. (2002). Expression analysis and subcellular distribution of the two G-protein regulators AGS3 and LGN indicate distinct functionality. Localization of LGN to the midbody during cytokinesis. J. Biol. Chem. 277, 15897–15903. - PubMed
    1. Chen, C., Zheng, B., Han, J., and Lin, S.C. (1997). Characterization of novel RGS proteins that bind to Gα proteins and inhibits pheromone signalling in yeast. J. Biol. Chem. 272, 8679–8685. - PubMed

MeSH terms

Substances

LinkOut - more resources