. 2003 Sep 2;100(18):10440-5.
doi: 10.1073/pnas.1832855100. Epub 2003 Aug 19.

Intense myocyte formation from cardiac stem cells in human cardiac hypertrophy

Affiliations

Intense myocyte formation from cardiac stem cells in human cardiac hypertrophy

Konrad Urbanek et al. Proc Natl Acad Sci U S A. .

Abstract

It is generally believed that increase in adult contractile cardiac mass can be accomplished only by hypertrophy of existing myocytes. Documentation of myocardial regeneration in acute stress has challenged this dogma and led to the proposition that myocyte renewal is fundamental to cardiac homeostasis. Here we report that in human aortic stenosis, increased cardiac mass results from a combination of myocyte hypertrophy and hyperplasia. Intense new myocyte formation results from the differentiation of stem-like cells committed to the myocyte lineage. These cells express stem cell markers and telomerase. Their number increased >13-fold in aortic stenosis. The finding of cell clusters with stem cells making the transition to cardiogenic and myocyte precursors, as well as very primitive myocytes that turn into terminally differentiated myocytes, provides a link between cardiac stem cells and myocyte differentiation. Growth and differentiation of these primitive cells was markedly enhanced in hypertrophy, consistent with activation of a restricted number of stem cells that, through symmetrical cell division, generate asynchronously differentiating progeny. These clusters strongly support the existence of cardiac stem cells that amplify and commit to the myocyte lineage in response to increased workload. Their presence is consistent with the notion that myocyte hyperplasia significantly contributes to cardiac hypertrophy and accounts for the subpopulation of cycling myocytes.


Figures

Fig. 1.
Fig. 1.
Putative cardiac stem cells. Shown are detection of c-kit (A, green), MDR1 (B, purple), and Sca-1-reactive protein (C, yellow) in primitive cells (arrows) of hypertrophied hearts. Nuclei are stained by propidium iodide (PI; blue) and myocytes by cardiac myosin (red). (Bars = 10 μm.)
Fig. 2.
Fig. 2.
Commitment of primitive cells with cardiac hypertrophy. (A and B; the same field) A cardiac progenitor (A, arrowhead) shows c-kit on the surface membrane (green) and GATA-4 (A, red) in the nucleus, and the myocyte progenitor (B, arrow) exhibits in its nucleus GATA-4 (A, red) and MEF2 (B, white). (C and D; the same field) A cardiac progenitor (C, arrowhead) shows MDR1 on the surface membrane (purple) and GATA-4 (C, red) in the nucleus, and a myocyte progenitor (D, arrow) exhibits in its nucleus GATA-4 (C, red) and MEF2 (D, white). (E, F, and G) Myocyte precursors (arrows) show on the surface membrane c-kit (E, green), MDR1 (F, purple), or Sca-1-like (G, yellow). A thin cytoplasmic layer is positive for cardiac myosin (E-G, red) and nuclei express MEF2 (E-G, white). (Bars = 10 μm.)
Fig. 3.
Fig. 3.
Telomerase and telomeric length. (A-D) c-kit-positive cells (green, arrows) expressing telomerase (A and C, white) in nuclei. Nuclei are also positive for MCM5 (B and D, red). The c-kit-positive cell (C and D) has a thin myocyte cytoplasmic layer (cardiac myosin, red; arrowheads). (E) Number of primitive, early committed cells and small amplifying myocytes expressing telomerase and MCM5. Results are mean ± SD. *, P < 0.001 between hypertrophied (aortic stenosis, AS) and control (C) hearts. (F) Telomerase activity in control (Con) and hypertrophied (AS) hearts; products of telomerase activity start at 50 bp and display 6-bp periodicity. Lysates treated with RNase (+) were used as negative control and HeLa cells as positive control. (G) Telomeric restriction fragment lengths in control (Con) and hypertrophied (AS) hearts; immortal cell lines of known mean telomeric length, 10.2 and 7.0 kbp, were used as baseline.
Fig. 4.
Fig. 4.
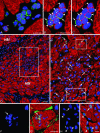
Intense growth in the hypertrophied heart. (A) Group of 12 c-kit-positive cells (green) surrounded by myocytes (red). Several nuclei express GATA-4 (yellow). One cell has a thin layer of myocyte cytoplasm (myosin, red, asterisk). (B and C) A second group of nine small cells with a ring of myocyte cytoplasm (myosin, red). Three of these cells exhibit c-kit (green; arrows) and seven (arrowheads) express both telomerase (B, white) and MCM5 (C, purple). (D) Low-power field of a cluster (rectangle) of small poorly differentiated myocytes within the hypertrophied myocardium (HM). Myocytes are labeled by cardiac myosin (red) and nuclei by propidium iodide (blue). The area in the rectangle is illustrated at higher magnification in E, in which Ki67 (yellow) labels a large number of myocyte nuclei (arrows). The two small rectangles delimit areas shown at higher magnification in F-I. A mitotic nucleus with metaphase chromosomes (F and G; arrows) is positive for Ki67 (G, yellow) and the boundary of the cell is defined by laminin (G, green). Another mitotic nucleus (H; arrow) is labeled by Ki67 (I, yellow; arrow). c-kit-positive cells (I, green; arrowheads) are near the mitotic myocyte. One shows Ki67 (I, yellow; asterisk). (Bars = 10 μmin A-C and F-I; bars = 50 μmin D and E).
Fig. 5.
Fig. 5.
Number and size of cycling and noncycling myocytes. Results are mean + SD. *, P < 0.001 between hypertrophied (AS) and control (C) hearts; †, P < 0.001 between cycling and noncycling p16-negative (p16-neg) and p16-positive (p16-pos) myocytes; ‡, P < 0.001 between noncycling p-16-neg and noncycling p16-pos myocytes.
Fig. 6.
Fig. 6.
Mitosis, karyokinesis, and cytokinesis in myocytes. A, D, G, J, and M illustrate chromosomes [propidium iodide (PI), blue]. B, E, H, K, and N show Ki67 in chromosomes (yellow). C, F, I, L, and O depict the combination of cardiac myosin (red) in myocytes with PI and Ki67 staining of mitotic nuclei (bright yellow). Arrows point to cytokinesis. (Bars = 10 μm.)

Similar articles

Cited by

References

    1. Beltrami, A. P., Urbanek, K., Kajstura, J., Finato, N., Bussani, R., Nadal-Ginard, B., Beltrami, C. A. & Anversa, P. (2001) N. Engl. J. Med. 344, 1750-1757. - PubMed
    1. Anversa, P. & Nadal-Ginard, B. (2002) Nature 415, 240-243. - PubMed
    1. Kajstura, J., Leri, A., Finato, N., Di Loreto, C., Beltrami, C. A. & Anversa, P. (1998) Proc. Natl. Acad. Sci. USA 95, 8801-8805. - PMC - PubMed
    1. Anversa, P. & Olivetti, G. (2002) in The Heart, Handbook of Physiology, Section 2: The Cardiovascular System, eds. Page, E., Fozzard, H. & Solaro, J. (Oxford Univ. Press, New York), Vol. 1, pp. 75-144.
    1. Wagers, A. J., Christensen, J. L. & Weissman, I. L. (2002) Gene Ther. 9, 606-612. - PubMed

Publication types