. 2003 Aug 20;23(20):7461-9.
doi: 10.1523/JNEUROSCI.23-20-07461.2003.

Spike width reduction modifies the dynamics of short-term depression at a central synapse in the locust

Affiliations

Spike width reduction modifies the dynamics of short-term depression at a central synapse in the locust

J E Niven et al. J Neurosci. .

Abstract

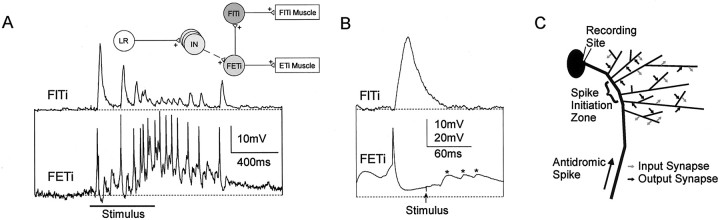
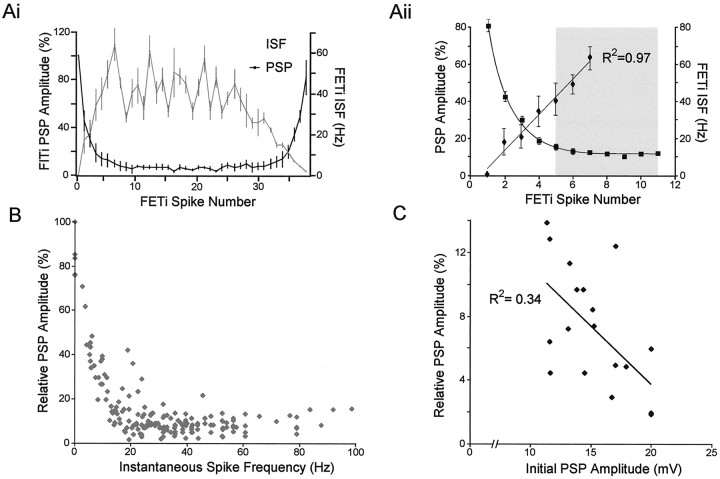
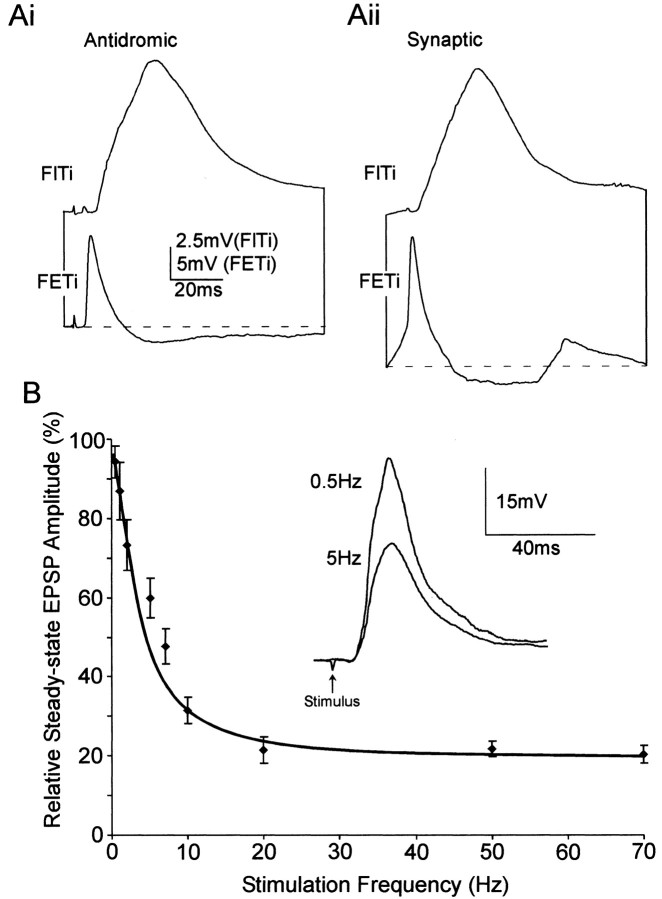
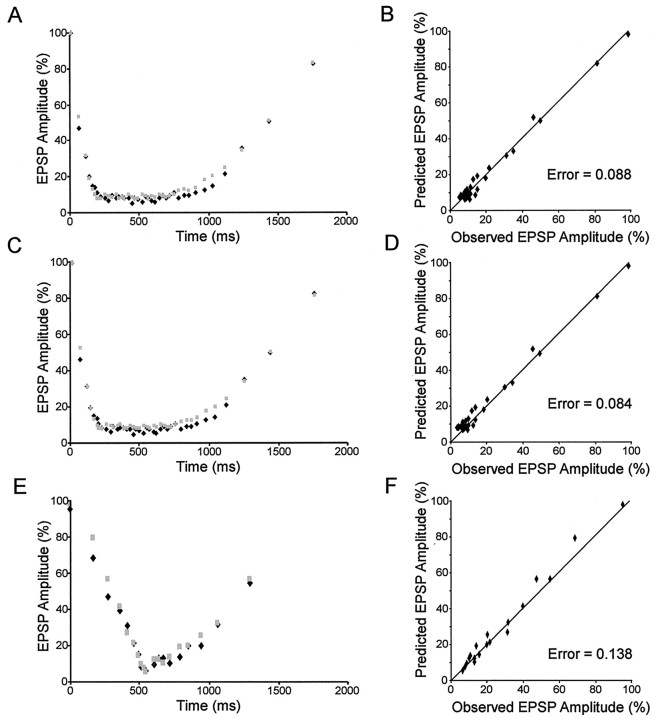
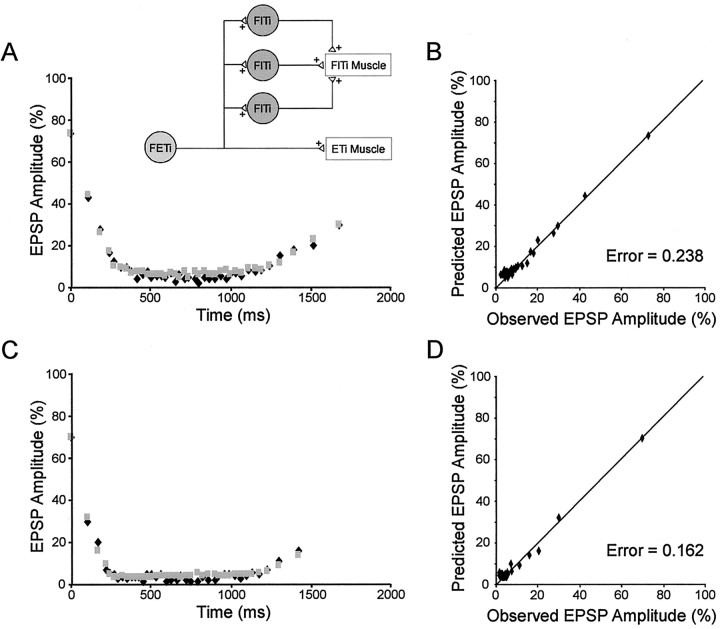
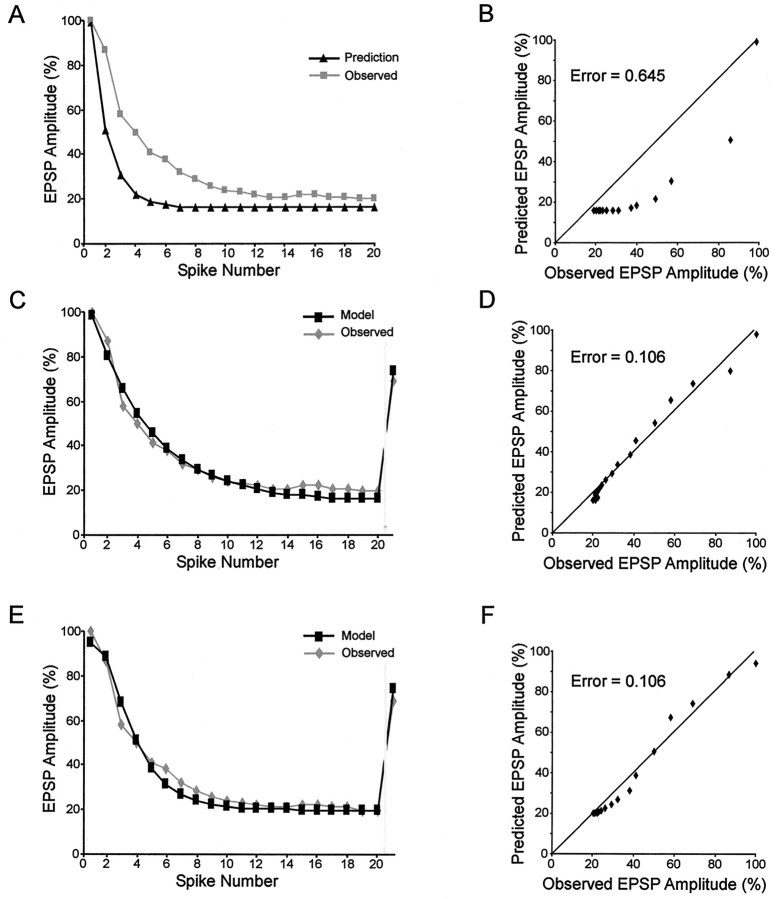
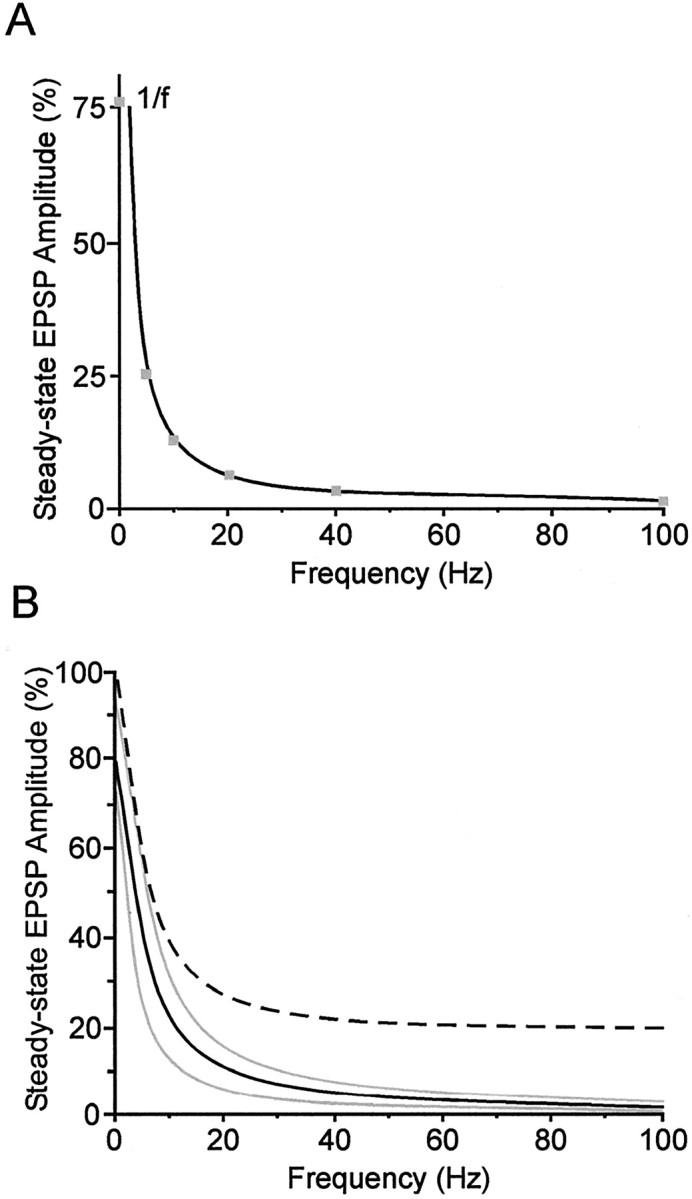
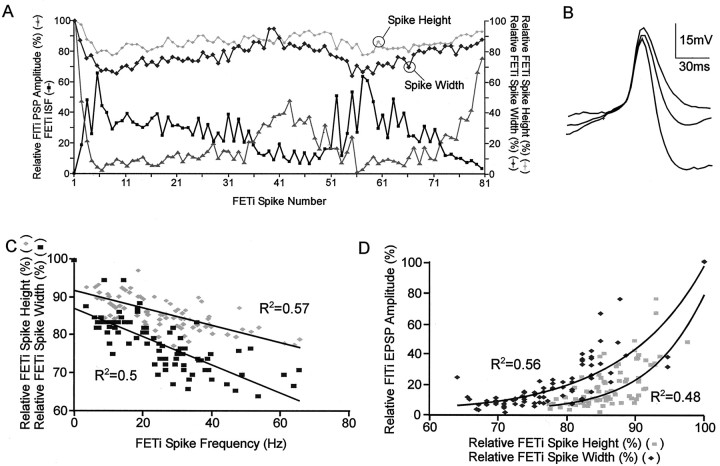
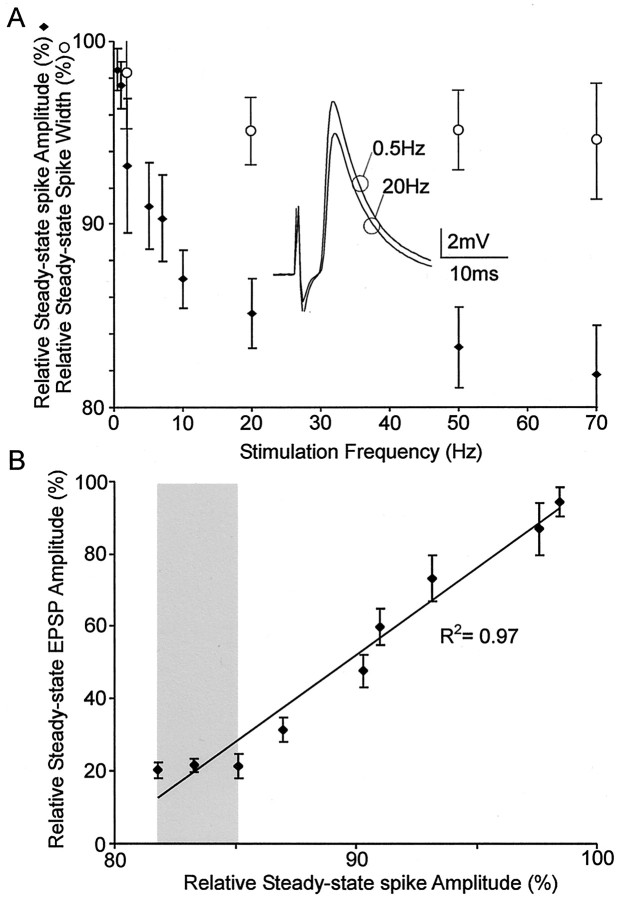
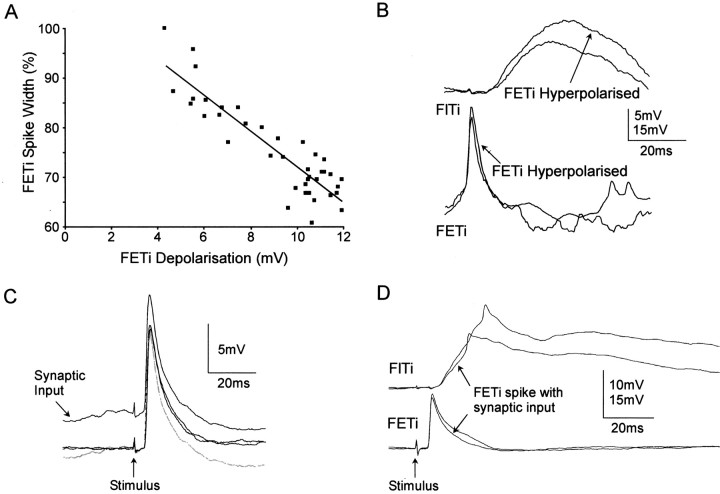
Short-term synaptic depression is an important component of computation within neural networks, but little is known of its contribution to information processing during synaptically generated spike trains. We analyzed short-term synaptic depression at a synapse between two identified motoneurons innervating the hind leg of the locust: the FETi-FlTi synapse (fast extensor tibiae-flexor tibiae). Brief electrical stimulation of a single hind leg proprioceptor, the lump receptor (LR), led to prolonged sequences of spikes in FETi, similar in number and frequency to those during natural kicking movements. Depression at the FETi-FlTi synapse during LR-evoked spike bursts was compared quantitatively to that during antidromic spike trains evoked by electrical stimulation of FETi in the extensor tibiae muscle, and by modeling. The magnitude of the short-term depression was significantly greater during LR-evoked spike trains. On the basis of the model parameters required to fit the depression, the FETi-FlTi synapse is predominantly used for transmitting the timing of the onset of FETi spiking rather than its spike rate. During LR-evoked spike trains, there was a rapid reduction in presynaptic spike width that did not occur during antidromic spike trains under physiological calcium concentrations. This produced a concomitant reduction in the amplitude of the FlTi EPSP, suggesting that it contributed to the differences between the two stimulation regimes. Differences in the short-term depression between synaptically evoked and antidromic spike trains emphasize that the properties of synaptic information transfer are dependent on the in vivo conditions at the synapse and may not be reproduced by in vitro spike trains.


Figures

Figure 1.
Figure 1.
Depression at the FETi-FlTi central synapse during synaptically evoked spike trains. A, Brief electrical stimuli applied to the LN evokes bursts of spikes in the FETi that continue after the termination of the stimuli. Spikes in FETi evoke an EPSP in antagonistic FlTi via a monosynaptic connection. Inset, A schematic of the circuit generating the bursts of spikes in FETi and their corresponding FlTi EPSPs. B, A single FETi spike evokes a monosynaptic EPSP in a FlTi. Stimulation of the LN evokes EPSPs in FETi (indicated by asterisk) that evoke spikes but does not evoke inputs to a subset of FlTi motoneurons, which receive inputs only from the FETi and not from local interneurons. C, A schematic diagram of the relative positions of input (black arrows) and output (gray arrows) synapses in FETi. Dashed lines indicate the resting potential in all traces.
Figure 2.
Figure 2.
The dynamics of depression at the FETi-FlTi synapse during natural-like synaptically evoked spike trains. Ai, The FETi ISF and posterior fast FlTi EPSP amplitude corresponding to each spike during a burst. Aii, The mean (±SE) of 19 FFlTi motoneuron EPSPs during bursts of spikes in FETi fitted by a single exponential. The shaded area indicates the plateau region of the FETi ISF. B, The relationship between the FETi ISF and FlTi EPSP amplitude for a single FETi-FlTi pair (n = 6) could be fitted by a single exponential decay. C, The relationship between depression at the FETi-FlTi synapse and the initial FlTi EPSP amplitude. The level of depression after 15 spikes was dependent on the initial FlTi EPSP amplitude; depression was greater after larger initial EPSPs than after smaller initial EPSPs.
Figure 3.
Figure 3.
Depression at the FETi-FlTi synapse during antidromically generated spike trains. A, EPSPs evoked in FlTi motoneurons have similar amplitudes and durations after antidromic spikes (left) and synaptically generated spikes (right) in FETi. B, Steady-state EPSP amplitudes after depression at the FETi-FlTi synapse during antidromic spike trains in FETi calculated after the first 10 spikes (mean ± SD; N = 12; n = 10) fitted with a single exponential. Inset, Mean steady-state EPSP amplitudes at 0.5 and 5 Hz from a single FlTi motoneuron (n = 10).
Figure 4.
Figure 4.
Modeling depression at the FETi-FlTi synapse during LR-evoked spike bursts. A, Averaged FlTi motoneuron responses during FETi spike bursts (n = 6) were fitted by a simple three-parameter model of synaptic depression (U = 0.61; A = 159.59; τRec = 505.32). The timing of each spike in a train was measured from the first spike in the train, and the observed (black) and predicted (gray) FlTi EPSPs are plotted for each spike. B, Plotting the model against the data show the fit of the model to the data. Points lying on the diagonal indicate a perfect fit. C, The addition of a facilitating parameter to the model did not improve the fit of the model to the data (U = 0.62; A = 158.07; τRec = 504.02; τFacil = 13.18). D, As in B. E, The parameters derived from fitting the model to the data enabled the model to accurately predict the responses of the same FlTi motoneuron to single FETi spike bursts not used to calculate the original model parameters. F, As in B.
Figure 6.
Figure 6.
Modeling depression in multiple types of FlTi motoneurons. A, The model accurately average response of an intermediate FlTi motoneuron during FETi spike bursts but with different parameters to the PFFlTi motoneuron shown in Figure 4 (U = 0.72; A = 97.04; τRec = 729.24). Inset, FETi makes monosynaptic connections to a population of nine FlTi motoneurons, up to three of which were recorded sequentially in a single preparation. B, Plotting the model against the data show the fit of the model to the data. Points lying on the diagonal indicate a perfect fit. C, The fit of the model to a second FFlTi motoneuron (anterior position) recorded in the same preparation (U = 0.67; A = 109.11; τRec = 508.87). D, As in B.
Figure 5.
Figure 5.
Model predictions do not fit observed antidromic spike trains. A, Parameters derived from fitting the model to FlTi responses during FETi spike bursts could not predict the responses of the same FlTi motoneurons to constant frequency antidromic spike trains at 20 Hz. B, Plotting the model against the data show the fit of the model to the data. Points lying on the diagonal indicate a perfect fit. C, The model could produce fits to constant frequency antidromic spike trains (U = 0.25; A = 394.31; τRec = 1420.70). The gray bar indicates a 1-sec period of recovery. D, As in B. E, The model with an additional facilitating time constant produced more accurate fits to the constant frequency antidromic spike trains (U = 0.43; A = 219.90; τRec = 1057.71; τFacil = 226.94). F, As in B.
Figure 7.
Figure 7.
Predictions from the model suggest a behavioral role for depression at the FETi-FlTi synapse. A, Model predictions of steady-state EPSP amplitude fit a 1/f relationship for frequencies above 5 Hz (see Results for details). B, Model predictions of the steady-state EPSP amplitude for all the FlTi motoneurons analyzed. The gray lines indicate the upper and lower limits of the model predictions determined by the parameters for individual FlTi motoneurons, and the mean is shown by the bottom black line. The top black is the mean steady-state amplitude for a typical FlTi motoneuron during antidromic spike trains.
Figure 8.
Figure 8.
Changes in the presynaptic waveform during natural-like bursts of spikes in FETi. A, The spike height and width varied during synaptically evoked bursts of spikes in FETi. B, Three FETi spikes aligned at their onset show clear changes in both spike height and width. C, Correlation of the FETi spike height and width with the frequency of spiking during bursts of spikes as shown in A. D, Correlation of the FlTi EPSP amplitude with the FETi spike height and width during synaptically evoked bursts of spikes.
Figure 9.
Figure 9.
Changes in the presynaptic waveform during antidromically generated spike trains in FETi. A, The steady-state spike height (black diamonds, calculated after the initial 10 spikes) and steady-state spike width (open circles) plotted against the antidromic spike frequency. Inset, The steady-state spike heights at 0.5 and 20 Hz. B, Relationship between the steady-state EPSP amplitude and the steady-state spike amplitude. The shaded region shows the plateau in the FlTi EPSP amplitude despite a continued drop in the FETi spike amplitude.
Figure 10.
Figure 10.
Spike width reduction during LR-evoked spike bursts may contribute to depression at the FETi-FlTi synapse. A, Changes in spike width correlate with changes in the depolarization of FETi immediately before the onset of the spike. B, Changes in the FETi spike height induced by injecting hyperpolarizing current produced a concomitant increase in the amplitude of the FlTi PSP. C, Three successive spikes during constant frequency antidromic spike trains synaptic inputs to FETi reduce the width of the antidromic spike. The second spike, which coincided with a synaptic input, has a reduced spike width. This trace is shifted (gray trace) to enable comparison with the other antidromic spikes. D, Antidromic spikes coinciding with synaptic inputs evoke smaller amplitude FlTi EPSPs.

Similar articles

Cited by

References

    1. Abbott LF, Sen K, Varela JA, Nelson SB ( 1997) Synaptic depression and cortical gain control. Science 275: 220-222. - PubMed
    1. Augustine G ( 1990) Regulation of neurotransmitter release at the squid giant synapse by presynaptic delayed rectifier current. J Physiol (Lond) 431: 343-364. - PMC - PubMed
    1. Burns MD, Usherwood PNR ( 1979) The control of walking in Orthoptera. II. Motor neurone activity in normal free-walking animals. J Exp Biol 79: 69-98.
    1. Burrows M ( 1995) Motor patterns during kicking movements in the locust. J Comp Physiol [A] 176: 289-305. - PubMed
    1. Burrows M ( 1996) The neurobiology of an insect brain, p 682. Oxford: Oxford University.

Publication types

LinkOut - more resources