. 2003 Aug 20;23(20):7551-8.
doi: 10.1523/JNEUROSCI.23-20-07551.2003.

Mechanisms of lateral inhibition in the olfactory bulb: efficiency and modulation of spike-evoked calcium influx into granule cells

Affiliations

Mechanisms of lateral inhibition in the olfactory bulb: efficiency and modulation of spike-evoked calcium influx into granule cells

Veronica Egger et al. J Neurosci. .

Abstract

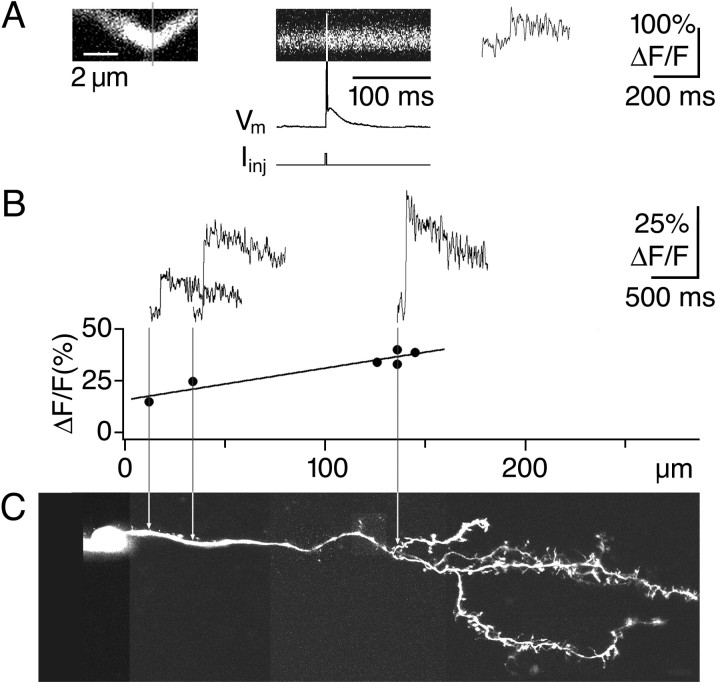
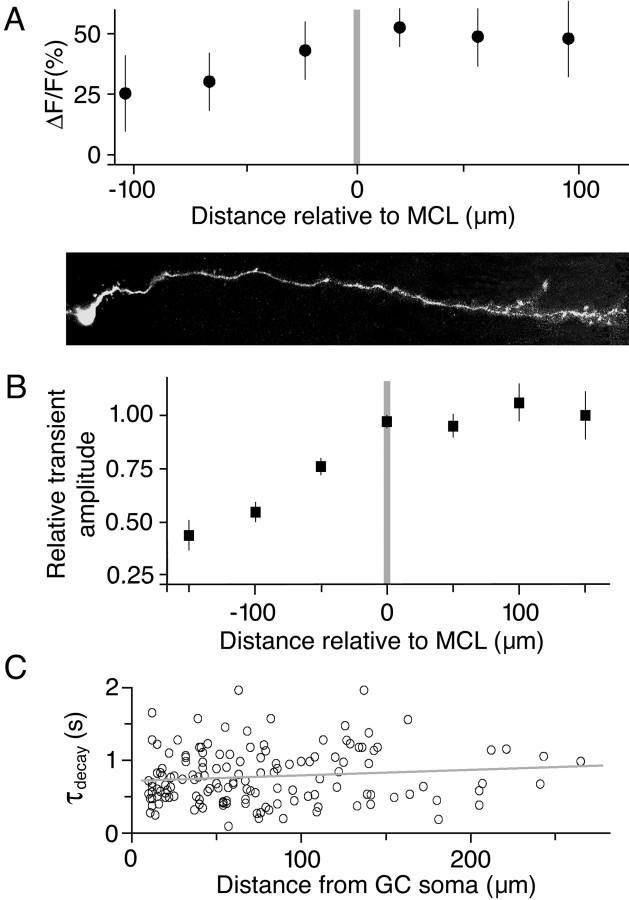
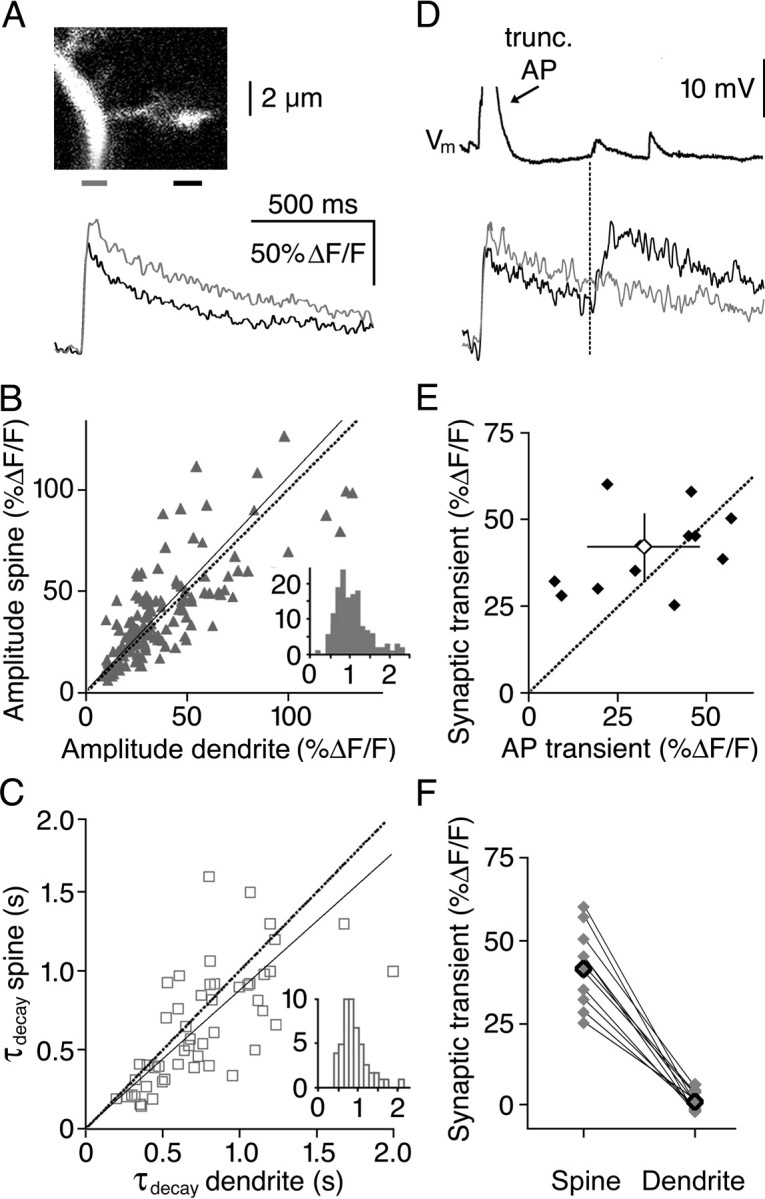
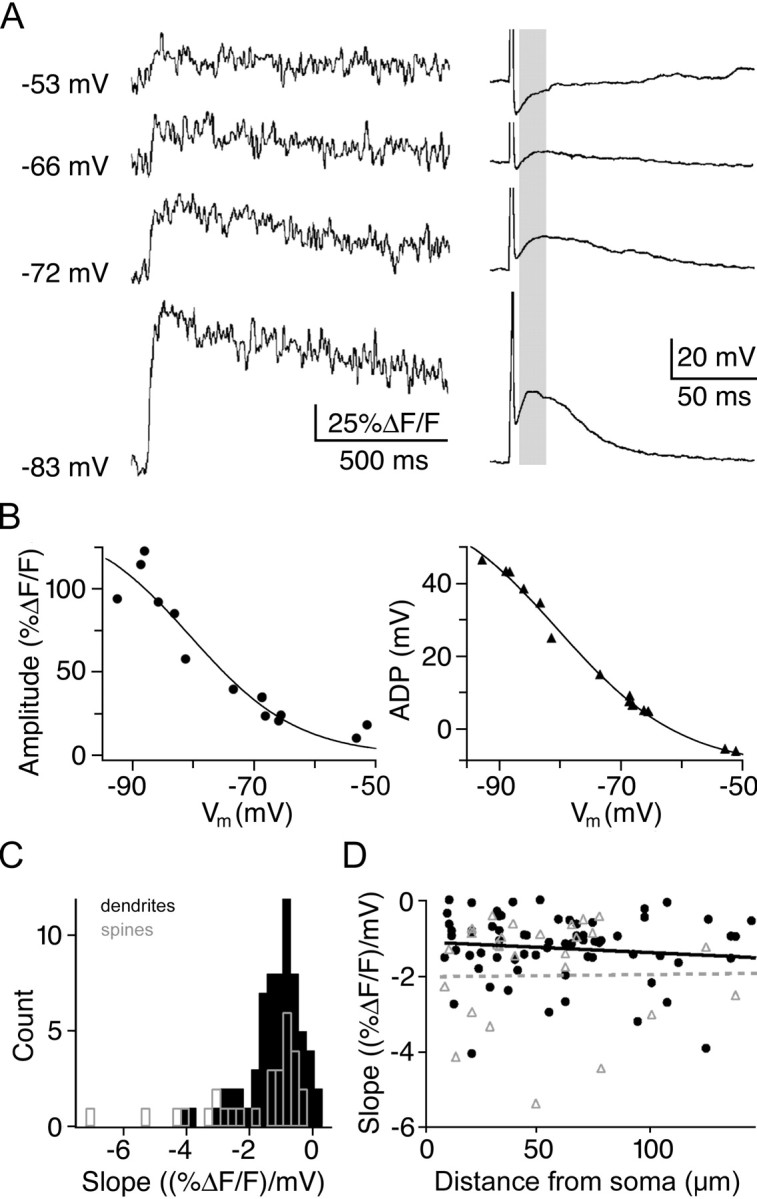
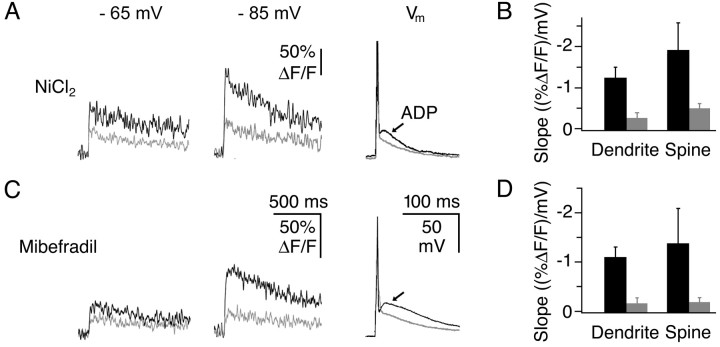
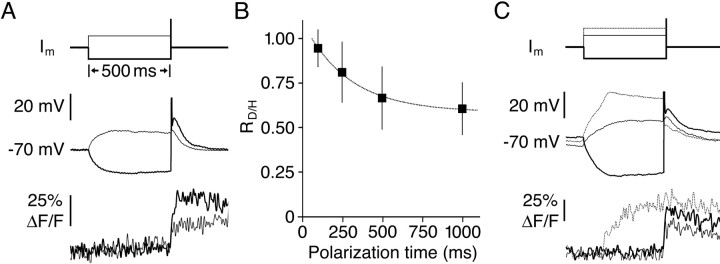
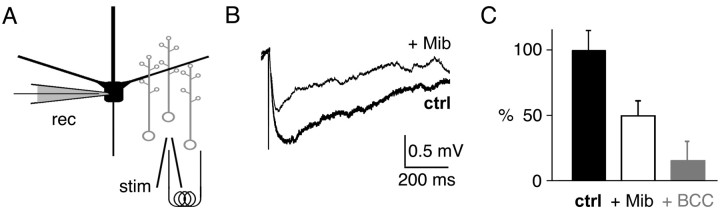
Granule cells are axonless local interneurons that mediate lateral inhibitory interactions between the principal neurons of the olfactory bulb via dendrodendritic reciprocal synapses. This unusual arrangement may give rise to functional properties different from conventional lateral inhibition. Although granule cells spike, little is known about the role of the action potential with respect to their synaptic output. To investigate the signals that underlie dendritic release in these cells, two-photon microscopy in rat brain slices was used to image calcium transients in granule cell dendrites and spines. Action potentials evoked calcium transients throughout the dendrites, with amplitudes increasing with distance from soma and attaining a plateau level within the external plexiform layer, the zone of granule cell synaptic output. Transient amplitudes were, on average, equal in size in spines and adjacent dendrites. Surprisingly, both spine and dendritic amplitudes were strongly dependent on membrane potential, decreasing with depolarization and increasing with hyperpolarization from rest. Both the current-voltage relationship and the time course of inactivation were consistent with the known properties of T-type calcium channels, and the voltage dependence was blocked by application of the T-type calcium channel antagonists Ni2+ and mibefradil. In addition, mibefradil reduced action potential-mediated synaptic transmission from granule to mitral cells. The implication of a transiently inactivating calcium channel in synaptic release from granule cells suggests novel mechanisms for the regulation of lateral inhibition in the olfactory bulb.


Figures

Figure 1.
Figure 1.
Action potentials produce calcium transients in granule cell dendrites. A, Experimental design. The left panel shows a dendrite of the cell in C, with the line scan position indicated by the gray vertical line. The middle panel shows the line scan across the dendrite (top), the voltage trace of the corresponding action potential (middle; white/black) evoked by current injection (bottom) to the granule cell soma. The right panel shows the fluorescence transient resulting from this line scan. B, (ΔF/F)AP amplitudes do not decrease with distance from the soma. The top traces represent averaged calcium transients imaged at increasing distance from the soma in the cell shown in C. The bottom graph shows dendritic (ΔF/F)AP amplitudes versus distance from the soma and their linear fit. C, Scan of the corresponding granule cell at the same scale. Arrows indicate the measurement locations.
Figure 2.
Figure 2.
Calcium transients are robust in the external plexiform layer. A, Calcium transient amplitudes attain a plateau in the EPL. The top graph represents dendritic (ΔF/F)AP amplitude data of the individual cell shown below at the same scale versus relative distance to the MCL. The soma of this cell was located at 120 μm below the MCL. Amplitude data are shown with SD. B, Normalized (ΔF/F)AP amplitudes averaged over all cells also attain a plateau in the EPL. The graph represents the average amplitudes of all granule cells with at least three dendritic data points (n = 98 cells) binned into 50 μm intervals, again versus their relative distance to the MCL. Before averaging, data from individual cells were normalized to the amplitude at the MCL border. Data are shown with SEM. C, The decay time constant of (ΔF/F)AP does not depend on distance from the soma. Dendritic data (n = 145) with linear fit (r = 0.11) is shown. Similar results were obtained for spine measurements (r = 0.03; n = 63; data not shown).
Figure 3.
Figure 3.
AP and synaptically mediated calcium transients are observed in spines. A, Spine and dendritic (ΔF/F)AP transients are similar. The scan shows a large spine/gemmule, located at 111 μm from the cell soma. Below, the averaged filtered transients in dendrite (gray) and spine (black) are shown, as measured in the regions with respective colors indicated below the scan. The horizontal line scan was aligned with the spine. B, Similar (ΔF/F)AP amplitudes are observed in dendrites and spines. The scatterplot shows transient amplitudes in spines versus transient amplitudes in the adjacent dendrite. The dotted line represents the diagonal x = y, and the straight line a linear fit to the data. The inset shows a histogram of amplitude ratios spine/dendrite. C, Slightly faster (ΔF/F)AP decay is seen in spines than in dendrites. The scatterplot shows transient decay constants in spines versus transient decay time constants in the adjacent dendrite, with details similar to B. D, Spontaneous synaptic events occur. The synaptic transient shown was measured in the spine from A, with identical scaling. The top trace shows the voltage recording with truncated evoked AP and spontaneous EPSPs. The bottom shows corresponding calcium signals in the spine (black) and adjacent dendrite (gray). Note that the AP evokes a transient both in spine and dendrite, whereas the spontaneous transient is localized to the spine and coincides with a spontaneous EPSP. E, Synaptic and AP-evoked ΔF/F amplitudes are similar. The scatterplot shows mean synaptic versus AP-evoked ΔF/F amplitudes in each spine where spontaneous synaptic events were observed (n = 12). The open diamond represents the population mean ± SD. F, Synaptic calcium is not observed in the adjacent dendrite. The plot shows mean synaptic ΔF/F amplitudes in all spine/dendrite pairs where spontaneous synaptic events were observed (n = 12). Mean values are represented by open diamonds.
Figure 4.
Figure 4.
Calcium transient amplitudes are regulated by membrane potential. A, Both (ΔF/F)AP and ADP amplitude are voltage-dependent. The left panel shows representative individual calcium transients at a fixed location ordered at increasingly hyperpolarized pre-pike membrane potentials, the right panel the corresponding APs (truncated) and ADPs. B, Voltage dependence obeys a Boltzmann relationship. (ΔF/F)AP amplitudes (left panel; from individual experiment also shown in A) and corresponding ADP amplitudes (right panel; calculated as difference between prespike potential and maximum within the shaded interval in A) are shown as a function of the prespike membrane potential. The Boltzmann fits yield V0.5 = -80.5 mV, k = 8.9 mV for (ΔF/F)AP and V0.5 = -80.3 mV, k = 10.2 mV for the ADPs. C, Histograms of all locations. The data are represented as histograms of the slopes of linear fits to the transient amplitudes from dendrites (n = 75; black solid bars) and spines (n = 31; gray open bars). D, Voltage dependence is independent on distance from soma. The slopes of linear fits to voltage dependence are shown versus distance of measurement from the soma. Black solid and gray dashed lines are linear fits to dendrite (filled circle) and spine (open triangle) data, respectively.
Figure 5.
Figure 5.
T-type calcium channels underlie voltage dependence of calcium transients. Black traces represent control data and gray traces data with drug applied (100 μm NiCl2, 1-10 μm mibefradil). A, B, NiCl2 reduces (ΔF/F)AP amplitude voltage dependence and blocks the ADP. C, D, Mibefradil also reduces (ΔF/F)AP amplitude voltage dependence and blocks the ADP. The three panels in A and C show individual experiments. The traces were recorded at prespike potentials of -65 and -85 mV, respectively, and the AP at -70 mV. B and D show the average linear slope of voltage dependence (see Materials and Methods) in dendrites and spines before and after drug application (error bars indicate SEM; NiCl2: n = 9 dendrites, n = 3 spines; mibefradil: n = 9 dendrites, n = 5 spines).
Figure 6.
Figure 6.
Voltage dependence of calcium transients develops rapidly. In all panels, thick traces mark hyperpolarization to approximately -90 mV, and thin traces depolarization to approximately -50 mV. Before the prepulse, cells were held at approximately -70 mV. A, Depolarizing versus hyperpolarizing 500 msec prepulses lead to a pronounced difference in (ΔF/F)AP amplitudes. The traces from a representative experiment show the injected current (top, schematic), the recorded somatic voltage (middle), and the respective calcium transients (bottom). B, Voltage dependence evolves with a time constant of ∼300 msec. Cumulative data from all experiments. Average data are plotted as ratios of transient amplitudes for depolarization and hyperpolarization, RD/H, versus duration of the polarization interval (100, 250, 500, and 1000 msec). Data are shown ± SD. The dotted line corresponds to a single exponential fit (τ = 290 msec). C, Close-to-spiking-threshold depolarization results in considerable calcium influx. Dashed traces mark strong depolarization. Again, the polarization interval was 500 msec. Note the characteristic hump in the dashed voltage recording.
Figure 7.
Figure 7.
Action potential-mediated synaptic transmission from granule cells to mitral cells is reduced by a T-type calcium channel antagonist. A, Experimental stimulation and recording scheme. Granule cells are stimulated extracellularly, whereas a mitral cell is being recorded from in whole-cell mode. B, Mibefradil reduces synaptic transmission. Traces from an individual experiment show averaged data (∼20 sweeps each) of the baseline IPSP (thick trace) and 15 min after application of 10 μm mibefradil (thin trace). C, Average reduction of synaptic transmission by mibefradil (n = 6 for control and mibefradil application, n = 3 for bicuculline application). Data are shown with SD.

References

    1. Bezprozvanny I, Tsien RW ( 1995) Voltage-dependent blockade of diverse types of voltage-gated Ca2+ channels expressed in Xenopus oocytes by the Ca2+ channel antagonist mibefradil (Ro 40-5967). Mol Pharmacol 48: 540-549. - PubMed
    1. Buonviso N, Chaput MA, Berthommier F ( 1996) Similarity of granular-induced inhibitory periods in pairs of neighboring mitral/tufted cells. J Neurophysiol 76: 2393-2401. - PubMed
    1. Cang J, Isaacson JS ( 2003) In vivo whole-cell recording of odor-evoked synaptic transmission in the rat olfactory bulb. J Neurosci 23: 4108-4116. - PMC - PubMed
    1. Chaput MA ( 1986) Respiratory-phase-related coding of olfactory information in the olfactory bulb of awake freely breathing rabbits. Physiol Behav 36: 319-324. - PubMed
    1. Chen WR, Xiong W, Shepherd GM ( 2000) Analysis of relations between NMDA receptors and GABA release at olfactory bulb reciprocal synapses. Neuron 25: 625-633. - PubMed

Publication types

LinkOut - more resources