. 2003 Aug 20;23(20):7621-9.
doi: 10.1523/JNEUROSCI.23-20-07621.2003.

Developmental modulation of retinal wave dynamics: shedding light on the GABA saga

Affiliations

Developmental modulation of retinal wave dynamics: shedding light on the GABA saga

Evelyne Sernagor et al. J Neurosci. .

Abstract

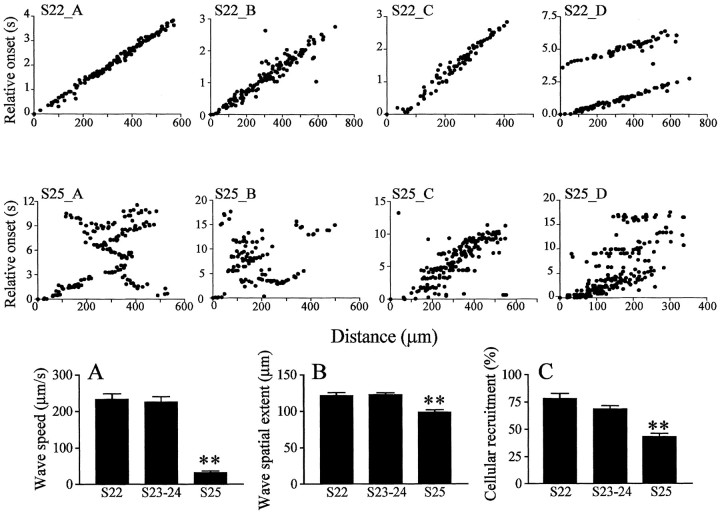
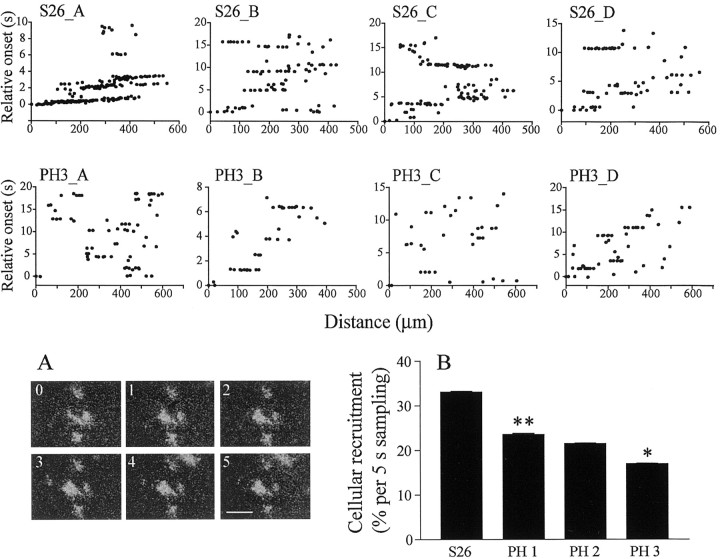
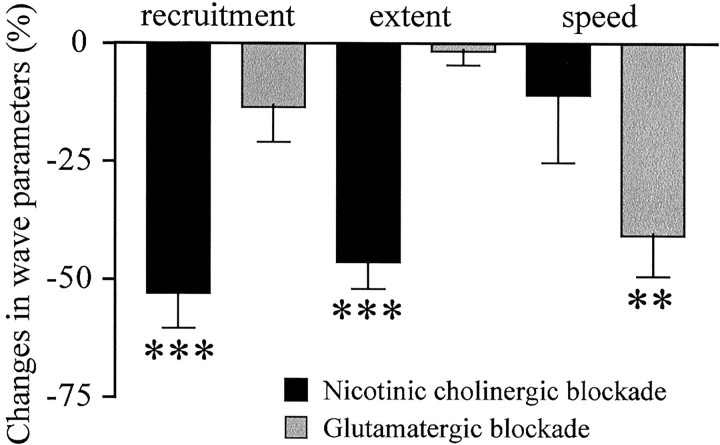
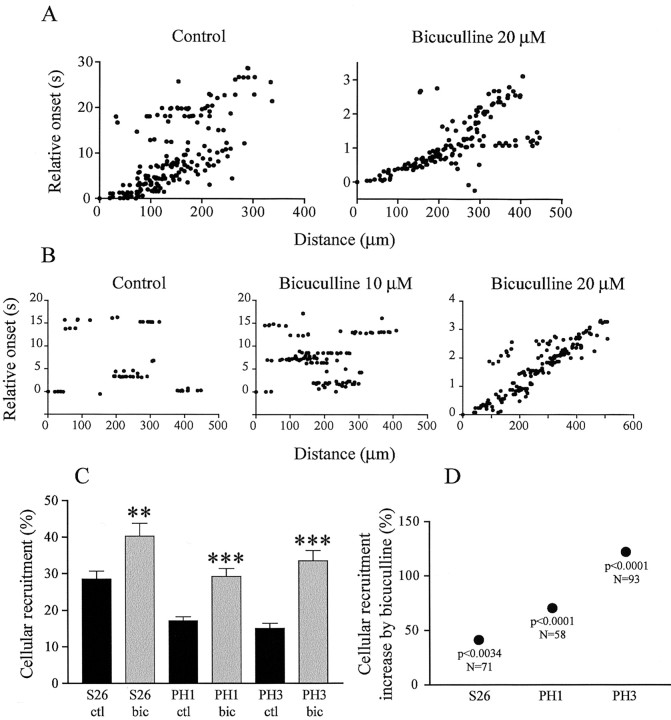
Embryonic spontaneous activity, in the form of propagating waves, is crucial for refining visual connections. To study what aspects of this correlated activity are instructive, we must first understand how their dynamics change with development and what factors trigger their disappearance after birth. Here we report that in the turtle retina, GABA, rather than glutamate and acetylcholine, influences developmental changes in wave dynamics. Using calcium imaging of the ganglion cell layer, we report how waves switch from fast and broad, when they emerge, to slow and narrow a few days before hatching, coinciding with the emergence of excitatory GABA(A) receptor-mediated activity. Around hatching, waves gradually become stationary patches, whereas GABA(A) shifts from excitatory to inhibitory, coinciding with the upregulation of the cotransporter KCC2, suggesting that changes in intracellular chloride underlie the shift. Dark-rearing from hatching causes correlated spontaneous activity to persist, whereas GABA(A) responses remain excitatory, and KCC2 expression is weaker. We conclude that GABA plays an important regulatory role during the maturation of retinal neural activity. Using a simple and elegant mechanism, namely the switch from excitatory to inhibitory, GABA(A) receptor-mediated activity is necessary and sufficient to cause retinal waves to stop propagating, ultimately leading to the disappearance of correlated spontaneous activity. Moreover, our results suggest that visual experience modulates the GABAergic switch.


Figures

Figure 1.
Figure 1.
Retinal waves in the turtle embryo. A, Raw image (averaged over 60 frames) of calcium green dextran-labeled GCL from a whole-mount S24 retina. Each dot represents a labeled RGC. The white circles delimit three cells whose activity is illustrated in B. B, Video rate recording of increases in fluorescence intensity (ΔF/F) during a spontaneous wave of activity for the three cells demarcated in A. The horizontal dotted line shows the threshold for activity onset. The vertical line shows the onset time for cell 1, the first to become recruited in the wave. Delays to onset increase from cell 1-3, indicating wave propagation. All three cells exhibit recurring outbursts of activity during the wave, indicating the quality of temporal resolution in our recordings. C, Time-lapse images of a Ca2+ wave in a S22 retina. The background fluorescence has been subtracted from the images, so that only changes in fluorescence are apparent. Each image illustrates a single video frame obtained at a particular time elapsed from the beginning of the recording (indicated in seconds in the top left side of the image). The wave propagates from top (time 0) to bottom. Scale bar, 250 μm.
Figure 8.
Figure 8.
The neural cotransporter KCC2 is upregulated by a light-controlled mechanism during turtle retinal development. A, Left panel, Light micrograph of a vertical section through the central retina at S25. Cells and processes are revealed with the H&E stain. Horizontal lines demarcate the outer nuclear (ONL) layer. OPL, Outer plexiform layer; INL, inner nuclear layer; IPL, inner plexiform layer; GCL, ganglion cell layer. Middle panel, Fluorescence micrograph revealing the expression of KCC2 in the same retina as in the left panel. KCC2 is almost entirely restricted to the IPL and OPL, although there is some weak expression on cell bodies in the INL. The bandwidth of the labeling is narrower than the IPL itself (left panel). Right panel, Negative control (no primary antibody, NP). B, Same as A but for a PH3 retina. The bandwidth of the labeling is virtually the same as the IPL itself. C, Same as B but for a DR3 retina. The bandwidth of the labeling is narrower than the IPL itself, as in A. D, Developmental changes in IPL thickness. There is a large increase from S25 to S26, followed by a small decrease from S26 to PH3. The IPL is thicker in DR conditions (gray bar) than in matching controls (PH3). E, Developmental changes in the relative proportion of the IPL occupied by KCC2. There is a major increase from S25 to S26. DR leads to weakening of the labeling compared with matching controls (PH3). F, Developmental changes in KCC2 labeling intensity. The intensity decreases from S25 to S26, but then peaks at PH3, while it reaches its minimum at DR3. **p < 0.001; *p < 0.01 (N-K post test, each column is compared with the preceding one).
Figure 2.
Figure 2.
Developmental changes in wave dynamics. S22_A-S22_D, Relative onset plots from four different S22 retinas. S22_D shows two consecutive waves (∼3 sec apart) propagating in the same direction, as indicated by the similar slopes. Waves are fast and have a uniform front, as indicated by a linear increase in delays to onset with distance from the reference cell. S25_A-S25_D, Relative onset plots from four different S25 retinas. The plots reveal that waves are much slower and more winding than at S22. A-C respectively illustrate developmental changes (between S22 and S25) in wave speed, spatial extent, and cellular recruitment within waves. All three parameters decrease significantly at S25. Asterisks indicate statistical significance between that bar and the previous one (**p < 0.001; N-K post test). Error bars indicate SEM.
Figure 3.
Figure 3.
Waves become localized activity patches at hatching. S26_A-S26_D, Relative onset plots from four different retinas at S26. The plots reveal patches of synchronized activity across RGCs. In S26_A, there is still some propagation because the lines are slightly oblique. PH3_A-PH3_D, Relative onset plots from four different retinas at 3 weeks PH. Patches are now smaller and recruit fewer cells. A, Time-lapse images of spontaneous activity in a S26 retina. Conventions are like Figure 1C. The activity is now restricted to local patches. B, Decrease in cellular recruitment during spontaneous activity from S26 onward. Asterisks indicate statistical significance between that bar and the previous one (**p < 0.001; *p < 0.05; N-K post-test). Error bars indicate SEM.
Figure 4.
Figure 4.
Effects of partial cholinergic and glutamatergic blockade on wave dynamics. Percentage difference from control in cellular recruitment, wave spatial extent, and speed in the presence of cholinergic nicotinic (black bars) or glutamatergic (gray bars) antagonists (see Results for more details). Waves shrink during nicotinic blockade, whereas the main effect of glutamate blockade is to slow waves down. Asterisks indicate statistical significance between control and drug (***p < 0.0001; **p < 0.0067; two-tailed t test). Error bars indicate SEM.
Figure 5.
Figure 5.
Effects of GABAA receptor blockade on spontaneous activity. A, Relative onset plots from a S25 retina in control conditions and in the presence of bicuculline (20 μm). Propagation speed is ∼10-fold faster in bicuculline. B, Relative onset plots from a S26 retina in control conditions, 10, and 20 μm bicuculline. The dose-response effect of bicuculline is remarkable; at 10 μm, patches become larger and stronger, and when the concentration is doubled, activity reverts to fast propagation. C, Bicuculline-induced increase in cellular recruitment during spontaneous activity from S26 to PH3. Black bars, control; gray bars, bicuculline (2-5 μm) (**p < 0.001; ***p < 0.0001; two-tailed t test). Error bars indicate SEM. D, Percentage increase in cellular recruitment illustrated in C. The significance of the t test and the number of observations is indicated below each data point. The enhancing effect of bicuculline increases with development, suggesting that GABA becomes inhibitory.
Figure 6.
Figure 6.
GABA is excitatory at S25. A, Time-lapse images of a GABA-induced wave in a S25 retina. Conventions are the same as in Figures 1C and 3A. These “tidal” excitation waves recruit all RGCs, and they are very prolonged (last frame is taken at 95 sec from the beginning). B, GABA-evoked waves at S25 and S26. Each trace illustrates the activity averaged over the entire population of RGCs analyzed. Individual traces were shifted in time so that all peaks occurred at the same time. Dotted line as in Figure 1 B. C, Decrease in GABA-evoked wave duration from S26 onwards. **p < 0.001, N-K post-test. Error bars indicate SEM.
Figure 7.
Figure 7.
Dark-rearing enhances spontaneous activity and causes GABA to retain an excitatory component. DR3_A-DR4_B, Relative onset plots from two retinas at DR3 and two retinas at DR4. Spontaneous activity is strong (Fig. 3, compare PH3_A to PH3_D), and sometimes propagates smoothly (DR3_B). A, Cellular recruitment at PH2, PH3 (black bars), DR2-3, and DR4 (gray bars). Recruitment is much higher in DR retinas. **p < 0.001 (N-K post test, PH2 compared with DR2-3 and PH3, with DR4). B, GABA-induced wave in a DR4 retina (conventions as in Fig. 6 B). In normal rearing conditions, GABA is already inhibitory at that age. C, Bicuculline-induced (2-5 μm) increase in cellular recruitment in DR2-4 retinas. ***p < 0.0001. Error bars indicate SEM. D, Percentage increase in cellular recruitment induced by bicuculline (2-5 μm) from S26 to PH3 and in DR2-4. The progressive developmental increase in bicuculline efficacy at enhancing spontaneous activity is much weaker in DR conditions, suggesting that GABA has remained excitatory.

Similar articles

Cited by

References

    1. Bansal A, Singer JH, Hwang BJ, Xu W, Beaudet A, Feller MB ( 2000) Mice lacking specific nicotinic acetylcholine receptor subunits exhibit dramatically altered spontaneous activity patterns and reveal a limited role for retinal waves in forming on and off circuits in the inner retina. J Neurosci 20: 7672-7681. - PMC - PubMed
    1. Ben-Ari Y ( 2002) Excitatory actions of GABA during development: the nature of the nurture. Nat Rev Neurosci 3: 728-739. - PubMed
    1. Cardinali DP, Golombek DA ( 1998) The rhythmic GABAergic system. Neurochem Res 23: 607-614. - PubMed
    1. Catsicas M, Bonness V, Becker D, Mobbs P ( 1998) Spontaneous Ca2+ transients and their transmission in the developing chick retina. Curr Biol 8: 283-286. - PubMed
    1. Crair MC ( 1999) Neuronal activity during development: permissive or instructive? Curr Opin Neurobiol 9: 88-93. - PubMed

Publication types

LinkOut - more resources