. 2003 Aug 20;23(20):7630-41.
doi: 10.1523/JNEUROSCI.23-20-07630.2003.

Neural noise and movement-related codes in the macaque supplementary motor area

Affiliations

Neural noise and movement-related codes in the macaque supplementary motor area

Bruno B Averbeck et al. J Neurosci. .

Abstract

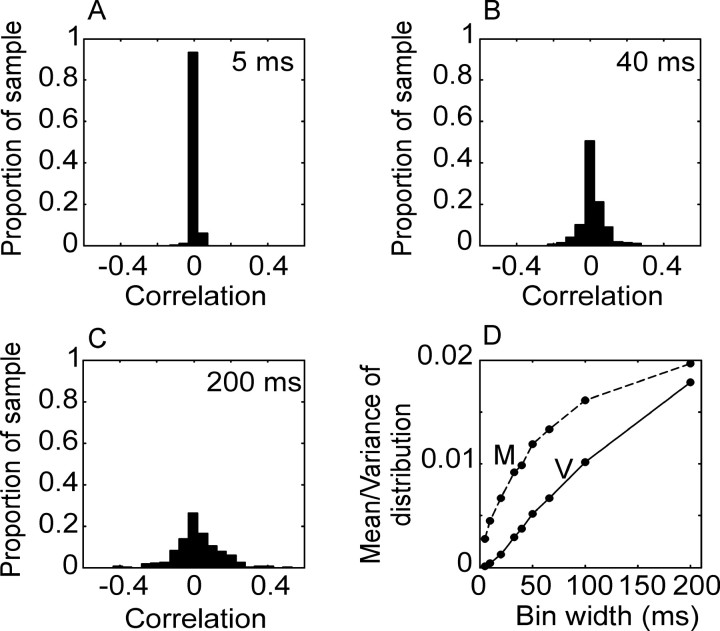
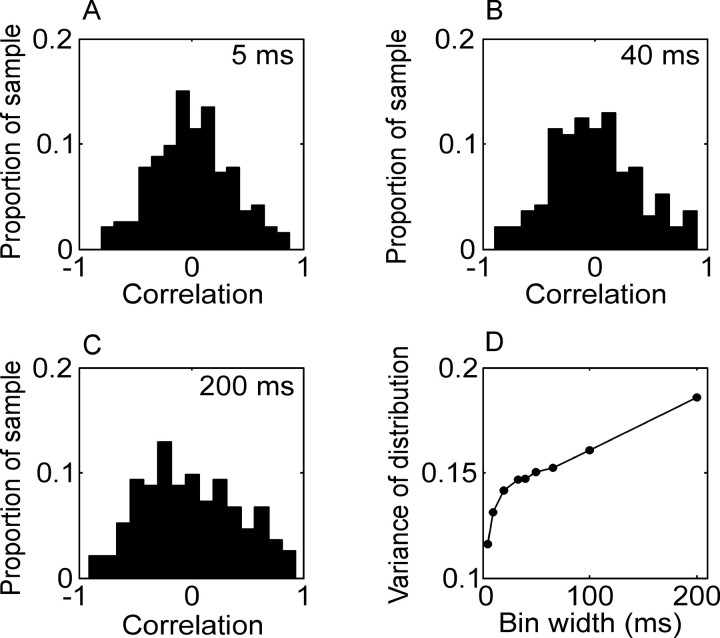
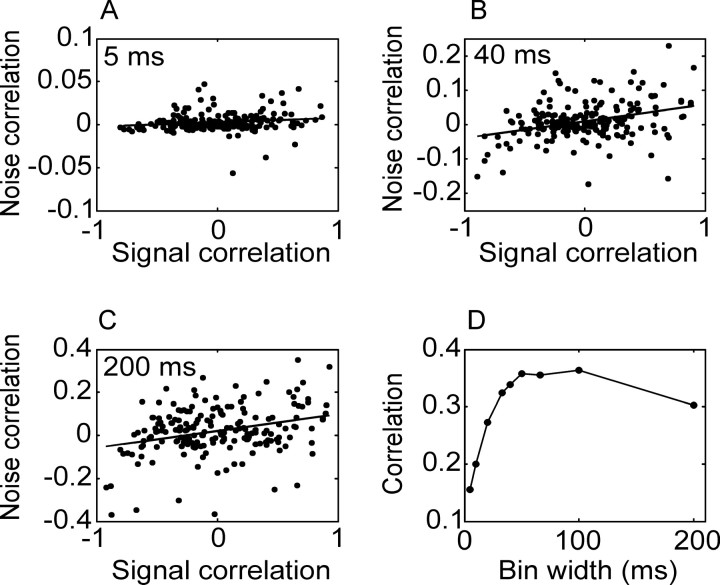
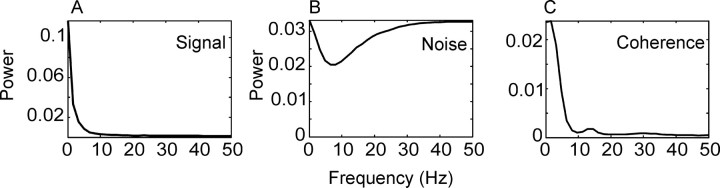
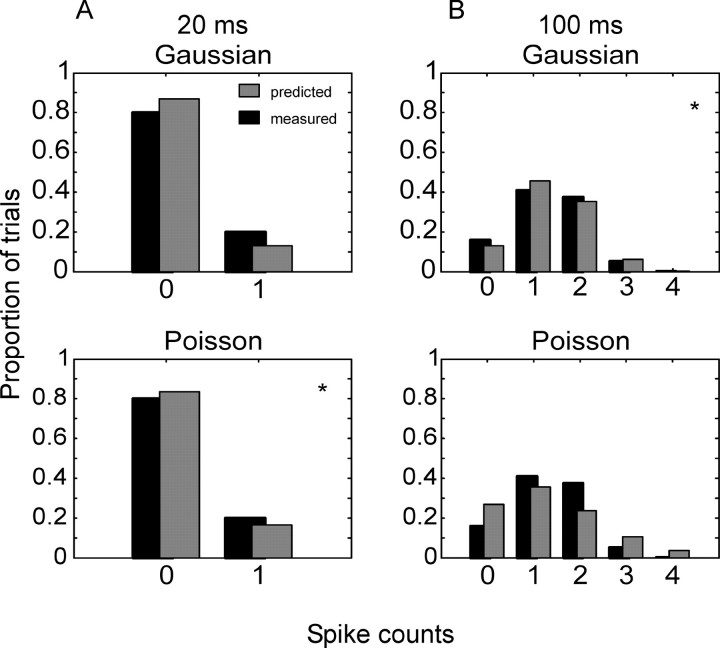
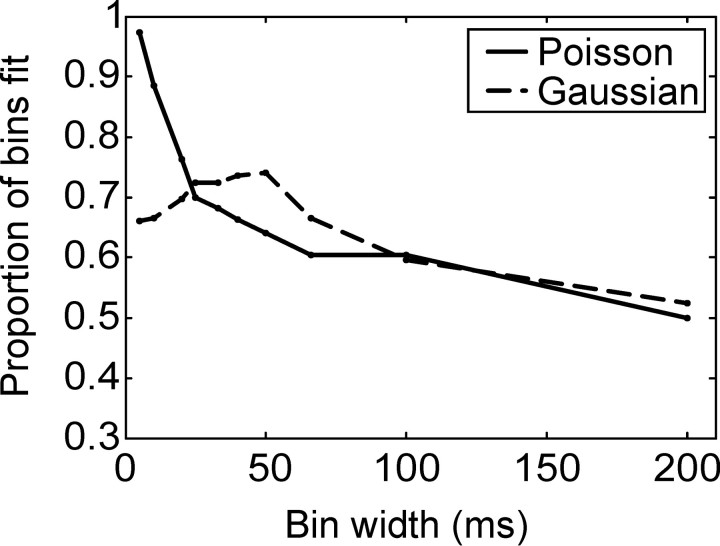
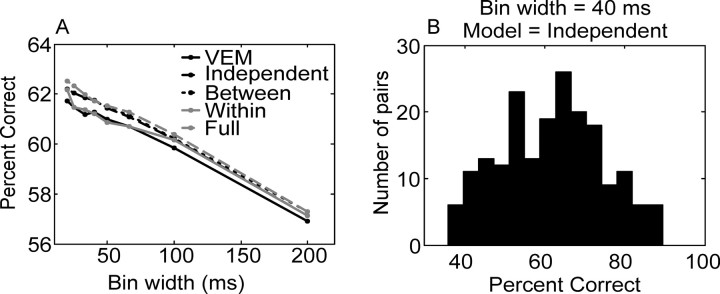
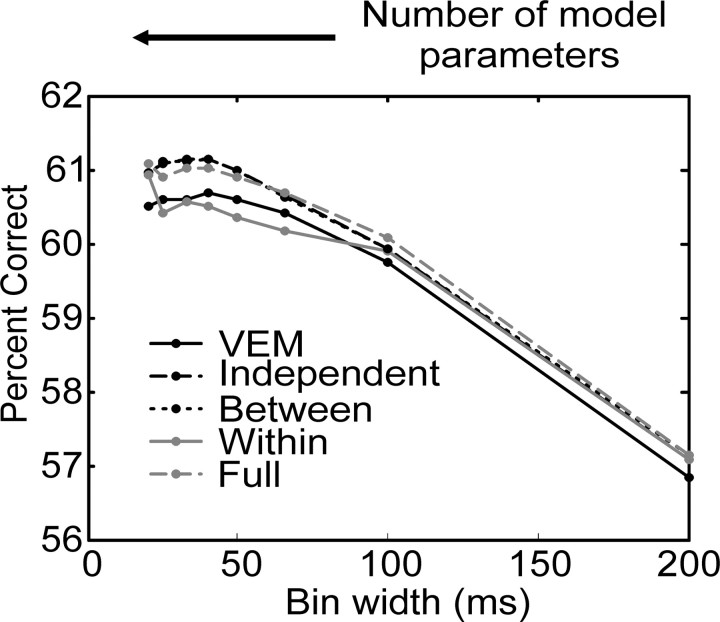
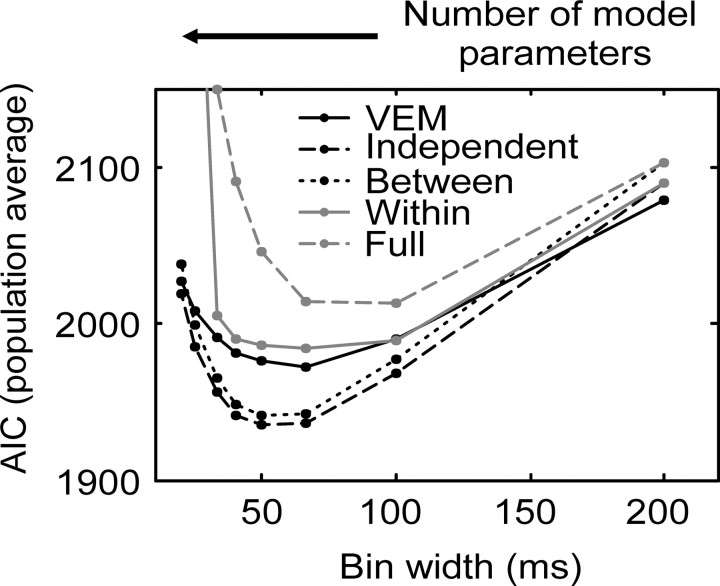
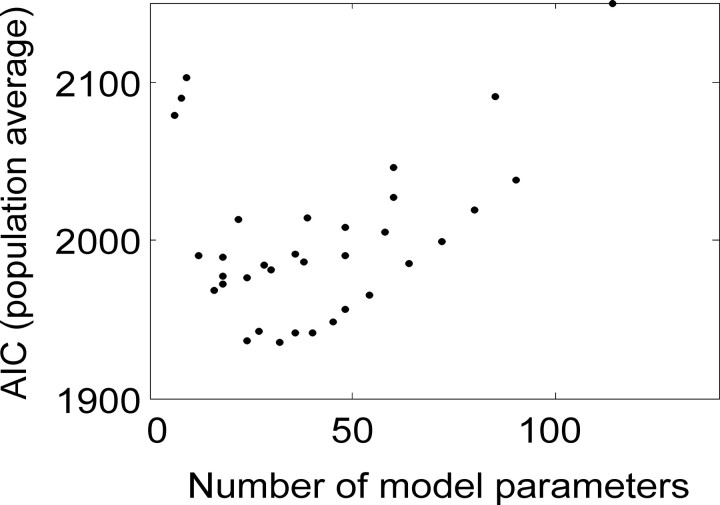
We analyzed the variability of spike counts and the coding capacity of simultaneously recorded pairs of neurons in the macaque supplementary motor area (SMA). We analyzed the mean-variance functions for single neurons, as well as signal and noise correlations between pairs of neurons. All three statistics showed a strong dependence on the bin width chosen for analysis. Changes in the correlation structure of single neuron spike trains over different bin sizes affected the mean-variance function, and signal and noise correlations between pairs of neurons were much smaller at small bin widths, increasing monotonically with the width of the bin. Analyses in the frequency domain showed that the noise between pairs of neurons, on average, was most strongly correlated at low frequencies, which explained the increase in noise correlation with increasing bin width. The coding performance was analyzed to determine whether the temporal precision of spike arrival times and the interactions within and between neurons could improve the prediction of the upcoming movement. We found that in approximately 62% of neuron pairs, the arrival times of spikes at a resolution between 66 and 40 msec carried more information than spike counts in a 200 msec bin. In addition, in 19% of neuron pairs, inclusion of within (11%)- or between-neuron (8%) correlations in spike trains improved decoding accuracy. These results suggest that in some SMA neurons elements of the spatiotemporal pattern of activity may be relevant for neural coding.


Figures

Figure 1.
Figure 1.
Distribution of number of neurons in each ensemble.
Figure 2.
Figure 2.
Single-cell raster for 249 trials of each of the three movements. These example movements were the first three of each behavioral trial. Rasters are aligned to target onset (0 msec).
Figure 3.
Figure 3.
Mean-variance relation for spike counts across the population for several bin widths. The left column shows the relation in log-log coordinates; the right column shows the relation in linear coordinates. Bin widths of 5, 40, and 200 msec are shown, as indicated by the number in each panel of the left column. The mean for each bin is plotted on the abscissa, and the variance is plotted on the ordinate. The scalloped line that defines the bottom of each distribution is the minimum obtainable variance, given that spikes are discrete events. The line with a slope of 1 defines the mean-variance function expected of a Poisson process, in which the mean equals the variance. For small bin sizes, most data fell below the unity line, and many data points actually had the minimum variance obtainable. For larger bin sizes, the mean-variance relation was distributed about unity. The data plotted included all bins, before and after target onset. When the analysis was restricted to the period after target onset, the results were similar. The slope of the best fit line (data not shown) was assessed using the following equation: log(var) = a + b*log(mean). The coefficients a and b were as follows: a = -0.21, b = 0.96; a = -0.58, b = 0.83; a = -0.05, b = 0.87 for the 5, 40, and 200 msec bin sizes, respectively.
Figure 4.
Figure 4.
Effect of positive correlation between spikes within a bin on variance of spike counts. A, Correlation matrix from a sample neuron for a 200 msec period at a 1 msec resolution. Time 0 corresponds to stimulus onset. The peak equal to 1 along the main diagonal has been removed. The refractory period, which is the dark region paralleling the diagonal from the bottom left to the top right becomes smaller late in the epoch. Either a decrease in the refractory period or an increase in the positive correlation in the flanks contributes to the increase in the variance, after ∼60 msec. B, Interspike interval histogram for the same neuron. This neuron showed a large peak at short latencies, attributable to bursting. C, Variance plotted as a function of bin size for the correlation matrix shown in A, per Equation 9. All bins start at time 0. The line labeled “Independent” represents the variance that would be obtained if the spikes within the bin were independent. This variance is given by Equation 9 when ρtt' is zero between all bins. The line labeled “Correlated” shows the variance component attributable to the correlation, which is given by the second sum in Equation 9. The total variance is given by the line labeled “Total.”
Figure 5.
Figure 5.
Correlation in residual (noise correlation) as a function of bin size. A-C show the distribution of correlation coefficients for the population of pairs of neurons analyzed for three different bin widths: 5, 40, and 200 msec. D, Mean and the variance of the distribution of correlation coefficients as a function of bin size. Dashed line is mean (M); solid line is variance (V).
Figure 6.
Figure 6.
Correlation in PSTH (signal correlation). Conventions are as in Figure 5. There was little systematic effect of bin size on the mean of the distribution of correlations in the mean response (data not shown). The variance of the distribution of correlations in the mean is plotted in D. As with the correlation in the noise, increasing the bin size increases the variance of the signal correlation.
Figure 7.
Figure 7.
Correlation between signal correlation and noise correlation for pairs of neurons. Conventions are as in Figure 5. The signal and noise correlation were positively correlated. Furthermore, the correlation increased as a function of bin size. Note the difference in the scale for the vertical axes in A-C, reflecting the narrower distribution of correlated noise for smaller bin sizes.
Figure 8.
Figure 8.
Frequency domain representation of the neural signal in single and pairs of neurons. A, Population averaged periodogram of the PSTH. B, Population averaged periodogram of residual neural activity after the subtraction of the PSTH. C, Population averaged coherence plot between the residuals of neuron pairs. There is a bump at ∼12 Hz, which corresponds to β frequency oscillation, and a smaller bump centered around 30 Hz, which corresponds to γ frequency oscillation (Lee, 2003).
Figure 9.
Figure 9.
Examples of parametric distributions fit to empirical spike count distributions. The asterisk in the corner of a plot in each column indicates the distribution that fit the data, i.e., could not be rejected at a p value of 0.05 with the KS test. A, Normal and Poisson distributions fit to the data from a single 20 msec bin. B, Same distributions fit to the data from a single 100 msec bin.
Figure 10.
Figure 10.
Proportion of times that a Gaussian or Poisson distribution successfully fit the empirical distribution of spike counts as a function of bin size. Each neuron contributed several bins. For example, for a single neuron at a bin width of 10 msec there were 60 bins (600 msec, 10 msec bins) for each of three movements. Thus the parametric distributions considered were fit to 180 separate empirical distributions for each neuron, at the 10 msec bin width. Bins with a mean spike rate of 0 were not considered.
Figure 11.
Figure 11.
Percentage correct for all analyzed pairs of neurons. A, Mean percentage correct as a function of bin width and covariance model considered. VEM (solid black line) indicates the model with the variance set equal to mean, independent (dashed black line) is the model with the variance estimated from the data, between (dotted black line) considers interaction between neurons, within (solid gray line) considers interactions between time bins for a single neuron, and full (dashed gray line) is the full covariance matrix. B, An example distribution of percentage correct across the population at a bin width of 40 msec for the independent model.
Figure 12.
Figure 12.
Proportion correct in K-fold cross validation analysis. Different models are indicated using the same conventions as in Figure 11 A.
Figure 13.
Figure 13.
Population mean AIC as a function of bin width and model considered. Different models are indicated using the same conventions as in Figure 11 A.
Figure 14.
Figure 14.
Relation between the population average of AIC and the number of model parameters. The AIC first dropped quickly to a minimum at ∼40 model parameters and then increased again slowly. The shape of this function is characteristic of a model that is not poorly matched to the structure of the data. Furthermore the AIC value did not begin to decrease again for large numbers of parameters, and thus we did not inadvertently select overly complex models.

References

    1. Abbott LF, Dayan P ( 1999) The effect of correlated variability on the accuracy of a population code. Neural Comput 11: 91-101. - PubMed
    1. Averbeck BB, Crowe DA, Chafee MV, Georgopoulos AP ( 2003) Neural activity in prefrontal cortex during copying geometrical shapes. II. Decoding shape segments from neural ensembles. Exp Brain Res 150: 142-153. - PubMed
    1. Bair W, Koch C ( 1996) Temporal precision of spike trains in extrastriate cortex of the behaving macaque monkey. Neural Comput 8: 1185-1202. - PubMed
    1. Bair W, Koch C, Newsome W, Britten K ( 1994) Power spectrum analysis of bursting cells in area MT in the behaving monkey. J Neurosci 14: 2870-2892. - PMC - PubMed
    1. Bair W, Zohary E, Newsome WT ( 2001) Correlated firing in macaque visual area MT: time scales and relationship to behavior. J Neurosci 21: 1676-1697. - PMC - PubMed

Publication types

LinkOut - more resources