

Hierarchical model of gene regulation by transforming growth factor beta
- PMID: 12930890
- PMCID: PMC193550
- DOI: 10.1073/pnas.1834070100
Hierarchical model of gene regulation by transforming growth factor beta
Abstract
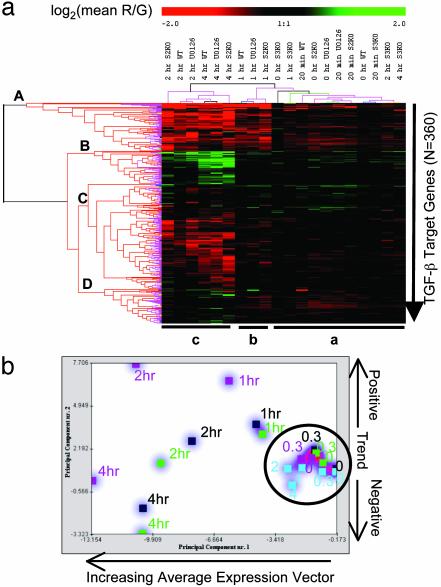
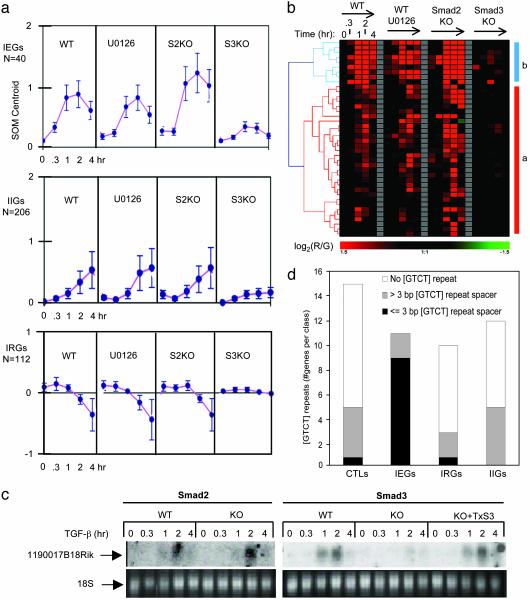
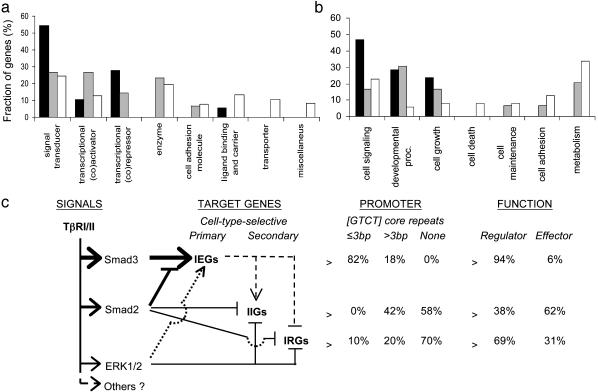
Transforming growth factor betas (TGF-betas) regulate key aspects of embryonic development and major human diseases. Although Smad2, Smad3, and extracellular signal-regulated kinase (ERK) mitogen-activated protein kinases (MAPKs) have been proposed as key mediators in TGF-beta signaling, their functional specificities and interactivity in controlling transcriptional programs in different cell types and (patho)physiological contexts are not known. We investigated expression profiles of genes controlled by TGF-beta in fibroblasts with ablations of Smad2, Smad3, and ERK MAPK. Our results suggest that Smad3 is the essential mediator of TGF-beta signaling and directly activates genes encoding regulators of transcription and signal transducers through Smad3/Smad4 DNA-binding motif repeats that are characteristic for immediate-early target genes of TGF-beta but absent in intermediate target genes. In contrast, Smad2 and ERK predominantly transmodulated regulation of both immediate-early and intermediate genes by TGF-beta/Smad3. These results suggest a previously uncharacterized hierarchical model of gene regulation by TGF-beta in which TGF-beta causes direct activation by Smad3 of cascades of regulators of transcription and signaling that are transmodulated by Smad2 and/or ERK.
Figures
Similar articles
-
Differential regulation of TGF-beta signaling through Smad2, Smad3 and Smad4.Oncogene. 2003 Oct 2;22(43):6748-63. doi: 10.1038/sj.onc.1206791. Oncogene. 2003. PMID: 14555988
-
Smad3 mediates transforming growth factor-beta-induced collagenase-3 (matrix metalloproteinase-13) expression in human gingival fibroblasts. Evidence for cross-talk between Smad3 and p38 signaling pathways.J Biol Chem. 2002 Nov 29;277(48):46338-46. doi: 10.1074/jbc.M206535200. Epub 2002 Sep 20. J Biol Chem. 2002. PMID: 12270924
-
Distinct roles of Smad2-, Smad3-, and ERK-dependent pathways in transforming growth factor-beta1 regulation of pancreatic stellate cellular functions.J Biol Chem. 2004 Mar 5;279(10):8873-8. doi: 10.1074/jbc.M309698200. Epub 2003 Dec 18. J Biol Chem. 2004. PMID: 14688282
-
Receptor-regulated Smads in TGF-beta signaling.Front Biosci. 2003 Sep 1;8:s1280-303. doi: 10.2741/1149. Front Biosci. 2003. PMID: 12957874 Review.
-
Smad3: a key player in pathogenetic mechanisms dependent on TGF-beta.Ann N Y Acad Sci. 2003 May;995:1-10. doi: 10.1111/j.1749-6632.2003.tb03205.x. Ann N Y Acad Sci. 2003. PMID: 12814934 Review.
Cited by
-
Genome-wide repression of NF-κB target genes by transcription factor MIBP1 and its modulation by O-linked β-N-acetylglucosamine (O-GlcNAc) transferase.J Biol Chem. 2012 Mar 23;287(13):9887-9900. doi: 10.1074/jbc.M111.298521. Epub 2012 Jan 31. J Biol Chem. 2012. PMID: 22294689 Free PMC article.
-
Genes involved in TGF beta1-driven epithelial-mesenchymal transition of renal epithelial cells are topologically related in the human interactome map.BMC Genomics. 2007 Oct 22;8:383. doi: 10.1186/1471-2164-8-383. BMC Genomics. 2007. PMID: 17953753 Free PMC article.
-
MicroRNA-192 in diabetic kidney glomeruli and its function in TGF-beta-induced collagen expression via inhibition of E-box repressors.Proc Natl Acad Sci U S A. 2007 Feb 27;104(9):3432-7. doi: 10.1073/pnas.0611192104. Epub 2007 Feb 20. Proc Natl Acad Sci U S A. 2007. PMID: 17360662 Free PMC article.
-
TGFbeta1 activates c-Jun and Erk1 via alphaVbeta6 integrin.Mol Cancer. 2003 Sep 23;2:33. doi: 10.1186/1476-4598-2-33. Mol Cancer. 2003. Retraction in: Mol Cancer. 2004 Jan 14;3:1. doi: 10.1186/1476-4598-3-1. PMID: 14572313 Free PMC article. Retracted.
-
Hepatocyte growth factor inhibits epithelial to myofibroblast transition in lung cells via Smad7.Am J Respir Cell Mol Biol. 2009 Jun;40(6):643-53. doi: 10.1165/rcmb.2008-0217OC. Epub 2008 Nov 6. Am J Respir Cell Mol Biol. 2009. PMID: 18988920 Free PMC article.
References
-
- Derynck, R., Akhurst, R. J. & Balmain, A. (2001) Nat. Genet. 29, 117-129. - PubMed
-
- Roberts, A. B. (2002) Cytokine Growth Factor Rev. 13, 3-5. - PubMed
-
- Massague, J. (2000) Nat. Rev. Mol. Cell Biol. 1, 169-178. - PubMed
-
- Dennler, S., Huet, S. & Gauthier, J. M. (1999) Oncogene 18, 1643-1648. - PubMed
-
- Yagi, K., Goto, D., Hamamoto, T., Takenoshita, S., Kato, M. & Miyazono, K. (1999) J. Biol. Chem. 274, 703-709. - PubMed
Publication types
MeSH terms
Substances
Grants and funding
LinkOut - more resources
Full Text Sources
Other Literature Sources
Molecular Biology Databases
Miscellaneous
