

Molecular imaging with endogenous substances
- PMID: 12930896
- PMCID: PMC193579
- DOI: 10.1073/pnas.1733836100
Molecular imaging with endogenous substances
Abstract
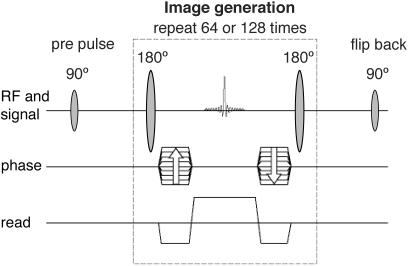
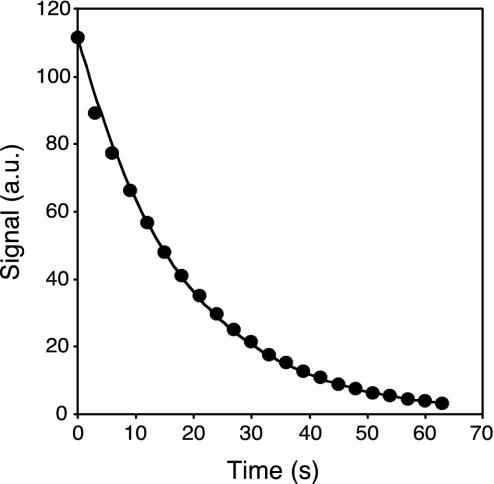
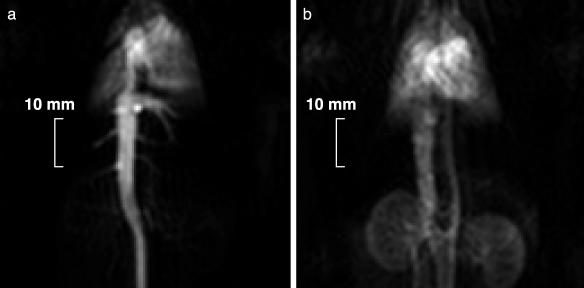
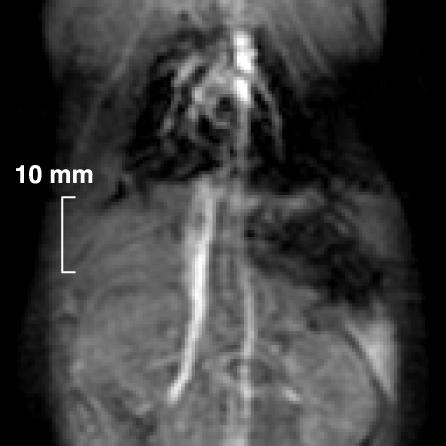
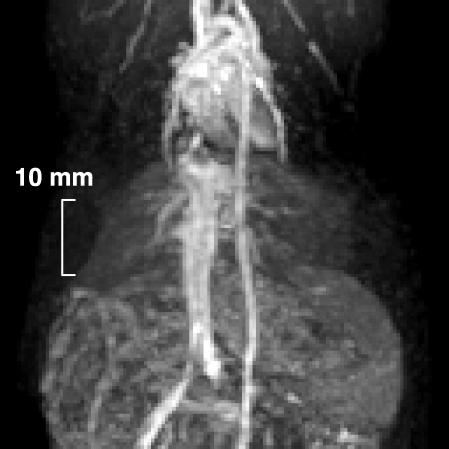
Dynamic nuclear polarization has enabled hyperpolarization of nuclei such as 13C and 15N in endogenous substances. The resulting high nuclear polarization makes it possible to perform subsecond 13C MRI. By using the dynamic nuclear polarization hyperpolarization technique, 10% polarization was obtained in an aqueous solution of 100 mM 13C-labeled urea, ready for injection. The in vivo T1 relaxation time of 13C in the urea solution was determined to 20 +/- 2 s. Due to the long relaxation time, it is possible to use the hyperpolarized substance for medical imaging. A series of high-resolution ( approximately 1-mm) magnetic resonance images were acquired, each with a scan time of 240 ms, 0-5 s after an i.v. injection of the hyperpolarized aqueous [13C]urea solution in a rat. The results show that it is possible to perform 13C angiography with a signal-to-noise ratio of approximately 275 in approximately 0.25 s. Perfusion studies with endogenous substances may allow higher spatial and/or temporal resolution than is possible with current proton imaging techniques.
Figures
References
-
- Haacke, E. M., Brown, R. W., Thompson, M. R. & Venkatesan, R. (1999) Magnetic Resonance Imaging—Physical Principles and Sequence Design (Wiley-Liss, New York), pp 331-380.
-
- Edelstein, W. A., Glover, G. H., Hardy, C. J. & Redington, R. W. (1986) Magn. Reson. Med. 3, 604-618. - PubMed
-
- Campeau, N. G., Huston, J., Bernstein, M. A., Lin, C. & Gibbs, G. F. (2001) Top. Magn. Reson. Imaging 12, 183-204. - PubMed
-
- Overhauser, A. W. (1953) Phys. Rev. 92, 411-412.
-
- Lurie, D. J., Bussell, D. M., Bell, L. H. & Mallard, J. R. (1988) J. Magn. Reson. 76, 366-370.
MeSH terms
Substances
LinkOut - more resources
Full Text Sources
Other Literature Sources
Medical
