

Determination of DNA minor groove width in distamycin-DNA complexes by solid-state NMR
- PMID: 12930959
- PMCID: PMC212816
- DOI: 10.1093/nar/gkg720
Determination of DNA minor groove width in distamycin-DNA complexes by solid-state NMR
Abstract
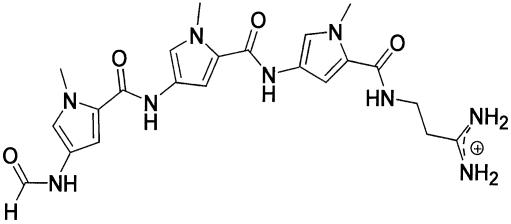
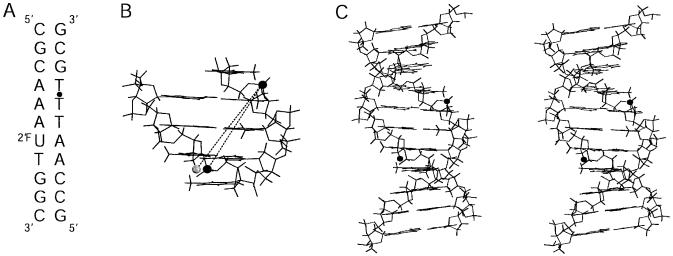
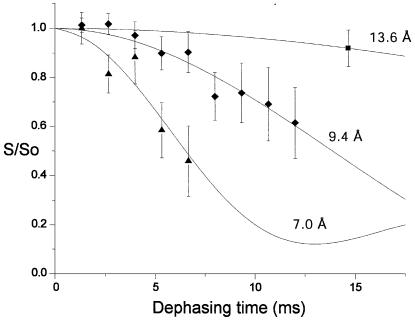
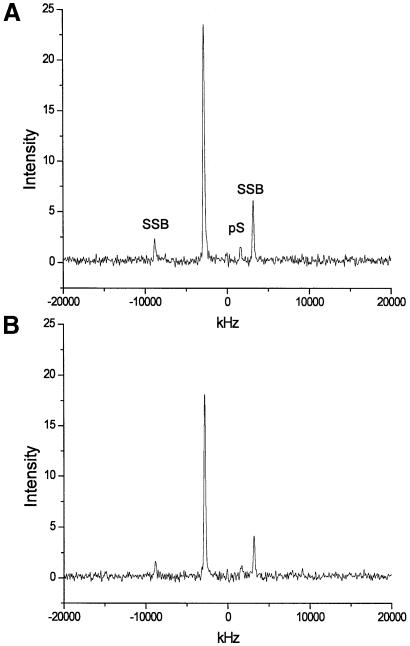
We have performed solid-state 31P-19F REDOR nuclear magnetic resonance (NMR) experiments to monitor changes in minor groove width of the oligonucleotide d(CGCAAA2'FUTGGC)*d(GCCAAT(pS)TT GCG) (A3T2) upon binding of the drug distamycin A at different stoichiometries. In the hydrated solid-state sample, the minor groove width for the unbound DNA, measured as the 2'FU7-pS19 inter-label distance, was 9.4 +/- 0.7 A, comparable to that found for similar A:T-rich DNAs. Binding of a single drug molecule is observed to cause a 2.4 A decrease in groove width. Subsequent addition of a second drug molecule results in a larger conformational change, expanding this minor groove width to 13.6 A, consistent with the results of a previous solution NMR study of the 2:1 complex. These 31P-19F REDOR results demonstrate the ability of solid-state NMR to measure distances of 7-14 A in DNA-drug complexes and provide the first example of a direct spectroscopic measurement of minor groove width in nucleic acids.
Figures
Similar articles
-
Interaction of minor groove ligands to an AAATT/AATTT site: correlation of thermodynamic characterization and solution structure.Biochemistry. 1995 Mar 7;34(9):2937-45. doi: 10.1021/bi00009a025. Biochemistry. 1995. PMID: 7893707
-
Quantitative structure of a complex between a minor-groove-specific drug and a bent DNA decamer duplex: use of 2D NMR data and NOESY constrained energy minimization.Biochemistry. 1990 May 15;29(19):4723-34. doi: 10.1021/bi00471a029. Biochemistry. 1990. PMID: 2164844
-
Configurational entropy change of netropsin and distamycin upon DNA minor-groove binding.Biophys J. 2006 Aug 15;91(4):1460-70. doi: 10.1529/biophysj.105.074617. Epub 2006 May 26. Biophys J. 2006. PMID: 16731550 Free PMC article.
-
Binding of two distamycin A molecules in the minor groove of an alternating B-DNA duplex.Nat Struct Biol. 1994 Mar;1(3):169-75. doi: 10.1038/nsb0394-169. Nat Struct Biol. 1994. PMID: 7656035
-
Distamycin A as stem of DNA minor groove alkylating agents.Curr Top Med Chem. 2004;4(2):231-9. doi: 10.2174/1568026043451474. Curr Top Med Chem. 2004. PMID: 14754456 Review.
Cited by
-
Crystal structure of the beta beta alpha-Me type II restriction endonuclease Hpy99I with target DNA.Nucleic Acids Res. 2009 Jun;37(11):3799-810. doi: 10.1093/nar/gkp228. Epub 2009 Apr 20. Nucleic Acids Res. 2009. PMID: 19380375 Free PMC article.
-
Binding of PFOS to serum albumin and DNA: insight into the molecular toxicity of perfluorochemicals.BMC Mol Biol. 2009 Feb 25;10:16. doi: 10.1186/1471-2199-10-16. BMC Mol Biol. 2009. PMID: 19239717 Free PMC article.
-
Advances in RNA Labeling with Trifluoromethyl Groups.Chemistry. 2023 Oct 26;29(60):e202302220. doi: 10.1002/chem.202302220. Epub 2023 Sep 20. Chemistry. 2023. PMID: 37534701 Free PMC article.
-
A nonafluoro nucleoside as a sensitive 19f NMR probe of nucleic acid conformation.Org Lett. 2008 Jul 3;10(13):2745-7. doi: 10.1021/ol800872a. Epub 2008 Jun 6. Org Lett. 2008. PMID: 18533676 Free PMC article.
-
Monitoring tat peptide binding to TAR RNA by solid-state 31P-19F REDOR NMR.Nucleic Acids Res. 2005 Jun 16;33(11):3447-54. doi: 10.1093/nar/gki626. Print 2005. Nucleic Acids Res. 2005. PMID: 15961729 Free PMC article.
References
-
- Ketchem R.R., Hu,W. and Cross,T.A. (1993) High-resolution conformation of gramicidin A in a lipid bilayer by solid-state NMR. Science, 261, 1457–1460. - PubMed
-
- Opella S.J., Kim,Y. and Mcdonnell,P. (1994) Experimental nuclear magnetic resonance studies of membrane proteins. Methods Enzymol., 239, 536–560. - PubMed
-
- Studelska D.R., Klug,C.A., Beusen,D.D., McDowell,L.M. and Schaefer,J. (1996) Long-range distance measurements of protein binding sites by rotational-echo double resonance NMR. J. Am. Chem. Soc., 118, 5476–5477.
-
- Merritt M.E., Christensen,A.M., Kramer,K., Hopkins,T. and Schaefer,J. (1996) Detection of intercatechol cross-links in insect cuticle by solid-state carbon-13 and nitrogen-15 NMR. J. Am. Chem. Soc., 118, 11278–11282.
-
- Wang J., Balazs,Y.S. and Thompson,L.K. (1997) Solid-state REDOR NMR distance measurements at the ligand site of a bacterial chemotaxis membrane receptor. Biochemistry, 36, 1699–1703. - PubMed
