Comparative Study
. 2003 Sep 1;31(17):5195-201.
doi: 10.1093/nar/gkg701.

Comparative analysis of the base biases at the gene terminal portions in seven eukaryote genomes

Affiliations
Comparative Study

Comparative analysis of the base biases at the gene terminal portions in seven eukaryote genomes

Yoshihito Niimura et al. Nucleic Acids Res. .

Abstract

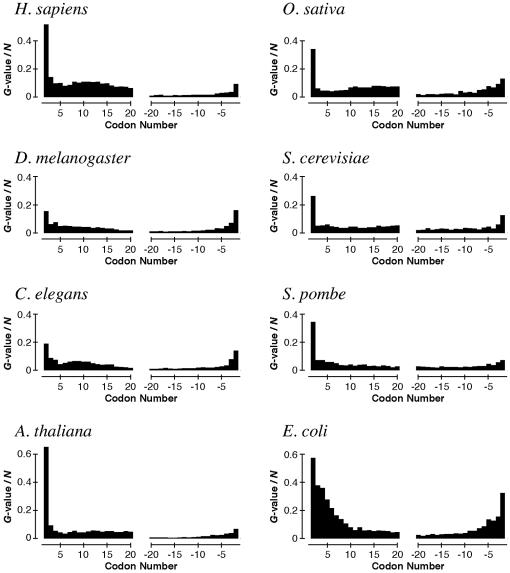
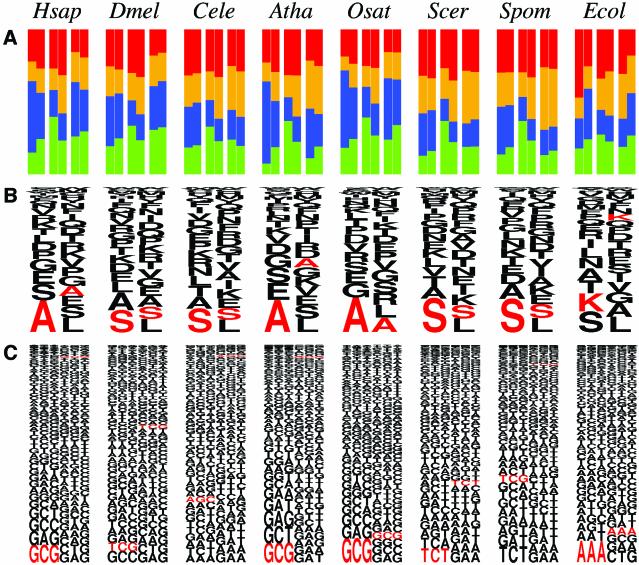
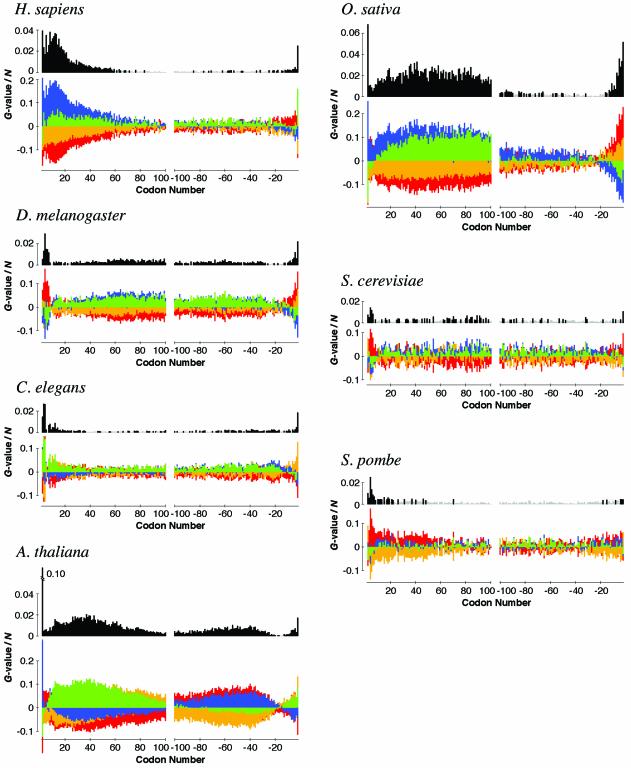
Adenine nucleotides have been found to appear preferentially in the regions after the initiation codons or before the termination codons of bacterial genes. Our previous experiments showed that AAA and AAT, the two most frequent second codons in Escherichia coli, significantly enhance translation efficiency. To determine whether such a characteristic feature of base frequencies exists in eukaryote genes, we performed a comparative analysis of the base biases at the gene terminal portions using the proteomes of seven eukaryotes. Here we show that the base appearance at the codon third positions of gene terminal regions is highly biased in eukaryote genomes, although the codon third positions are almost free from amino acid preference. The bias changes depending on its position in a gene, and is characteristic of each species. We also found that bias is most outstanding at the second codon, the codon after the initiation codon. NCN is preferred in every genome; in particular, GCG is strongly favored in human and plant genes. The presence of the bias implies that the base sequences at the second codon affect translation efficiency in eukaryotes as well as bacteria.


Figures

Figure 1
Figure 1
Biases in codon appearance at each position in genes of seven eukaryotes and E.coli. The biases are represented as the G-values divided by the gene number N (see Materials and Methods). The initiation and the termination codons are omitted, because the G-values at these codons are extremely high.
Figure 2
Figure 2
Biases at the second codon in the appearance of (A) bases, (B) amino acids and (C) codons for seven eukaryote species and E.coli. In (A), the fractions of the bases A (red), T (yellow), G (blue) and C (green) at the first (left), second (middle) and third (right) letters in codons are shown. In each rectangle, the left half represents the fraction of each base at the second codon and the right half represents the fraction of each base in the entire regions of all genes for a given species. In (B), the fraction of each amino acid at the second codon (left) and that in the entire region of all genes for each species (right) are shown. The height of each letter is proportional to the fraction of the amino acid represented by that one letter code. In (C), the fraction of each codon at the second codon (left) and that in the entire region of all genes (right) are shown. The height of each triplet is proportional to the fraction of the codon represented by that triplet. In (B) and (C), the characters are drawn in the order of their fractions from the bottom to the top. The amino acid or codon colored red is the one having the largest Z-value among all 20 amino acids or 61 codons, respectively, showing the most statistically biased amino acid or codon at the second codon for each species. Hsap, H.sapiens; Dmel, D.melanogaster; Cele, C.elegans; Atha, A.thaliana; Osat, O.sativa; Scer, S.cerevisiae; Spom, S.pombe; Ecol, E.coli.
Figure 3
Figure 3
Biases in base appearance at the third letter in each codon position for seven eukaryote species. In the upper graph, the biases are shown by the G-values divided by the gene number N (see Materials and Methods). Black and light gray bars correspond to probabilities smaller and larger than 0.1% (i.e. G-value = 16.27), respectively. Note that the threshold value of G/N corresponding to P = 0.1% is different from species to species, because N is species-dependent. In the lower graph, the values of the terms corresponding to each base, A (red), T (yellow), G (blue) or C (green), in the definition of the G-value are shown (see Materials and Methods). Positive and negative values are shown in the upper and lower parts of the graph, respectively, without any overlap. The total of four values depicted by four colored bars in the lower graph is equal to the G-value in the upper graph at each position. The initiation and the termination codons are omitted.

Similar articles

Cited by

References

    1. Shine J. and Dalgarno,L. (1974) The 3′-terminal sequence of Escherichia coli 16S ribosomal RNA: complementarity to nonsense triplets and ribosome binding sites. Proc. Natl Acad. Sci. USA, 71, 1342–1346. - PMC - PubMed
    1. Steitz J.A. and Jakes,K. (1975) How ribosomes select initiator regions in mRNA: base pair formation between the 3′ terminus of 16S rRNA and the mRNA during initiation of protein synthesis in Escherichia coli. Proc. Natl Acad. Sci. USA, 72, 4734–4738. - PMC - PubMed
    1. Looman A.C., Bodlaender,J., Comstock,L.J., Eaton,D., Jhurani,P., de Boer,H.A. and van Knippenberg,P.H. (1987) Influence of the codon following the AUG initiation codon on the expression of a modified lacZ gene in Escherichia coli. EMBO J., 6, 2489–2492. - PMC - PubMed
    1. Sato T., Terabe,M., Watanabe,H., Gojobori,T., Hori-Takemoto,C. and Miura,K. (2001) Codon and base biases after the initiation codon of the open reading frames in the Escherichia coli genome and their influence on the translation efficiency. J. Biochem., 129, 851–860. - PubMed
    1. Stenström C.M., Jin,H., Major,L.L., Tate,W.P. and Isaksson,L.A. (2001) Codon bias at the 3′-side of the initiation codon is correlated with translation initiation efficiency in Escherichia coli. Gene, 263, 273–284. - PubMed

Publication types