. 2003 Sep 1;31(17):e103.
doi: 10.1093/nar/gng104.

Parallel gene analysis with allele-specific padlock probes and tag microarrays

Affiliations

Parallel gene analysis with allele-specific padlock probes and tag microarrays

Johan Banér et al. Nucleic Acids Res. .

Abstract

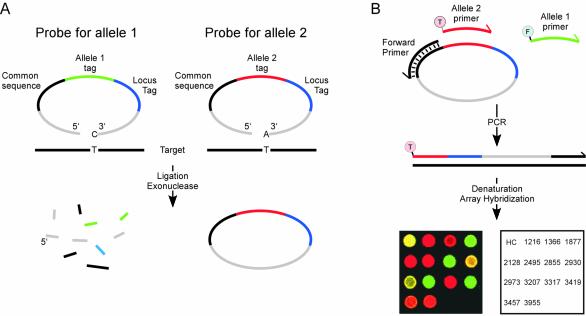
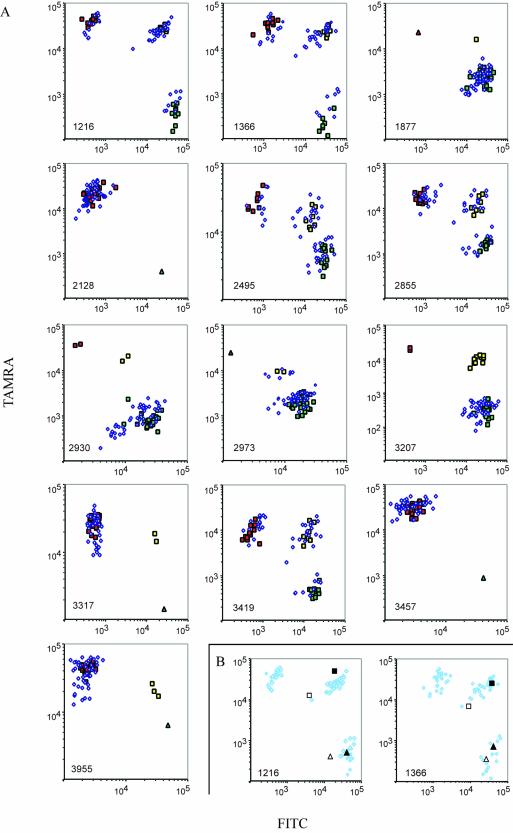
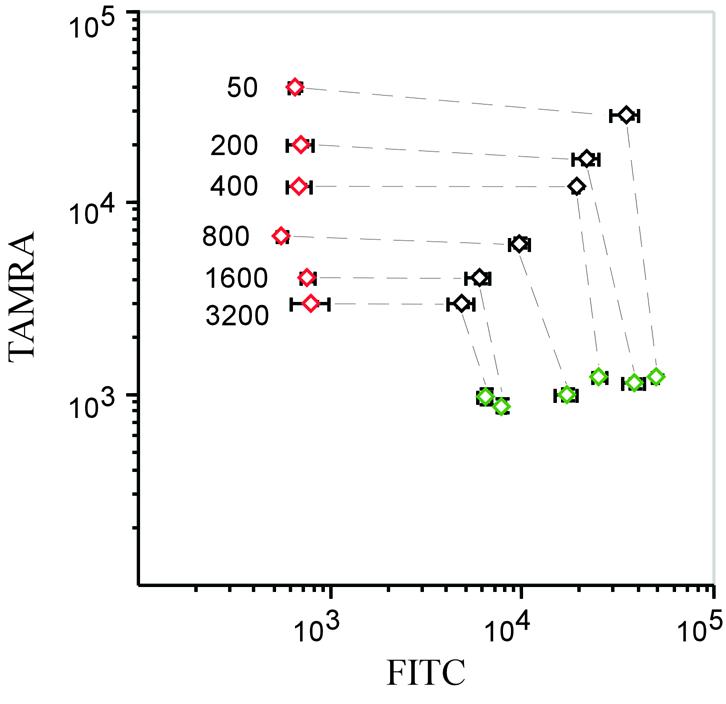
Parallel, highly specific analysis methods are required to take advantage of the extensive information about DNA sequence variation and of expressed sequences. We present a scalable laboratory technique suitable to analyze numerous target sequences in multiplexed assays. Sets of padlock probes were applied to analyze single nucleotide variation directly in total genomic DNA or cDNA for parallel genotyping or gene expression analysis. All reacted probes were then co-amplified and identified by hybridization to a standard tag oligonucleotide array. The technique was illustrated by analyzing normal and pathogenic variation within the Wilson disease-related ATP7B gene, both at the level of DNA and RNA, using allele-specific padlock probes.


Figures

Figure 1
Figure 1
Parallel padlock probe analysis of single nucleotide variation. (A) Padlock probes included two target-complementary sequences at both the 5′ and 3′ ends (grey) and the allele-specific nucleotide was positioned at the 3′-end. The target-specific ends were connected by the following sequence elements, 20 nt each, in 5′→3′ order: one sequence common for all probes used for amplification (black), either of two allele-specific tags (green or red) and, finally, a tag sequence unique for each locus (blue). Only probe arms correctly hybridized to a target sequence (black line) are efficiently joined by a ligase. After ligation, unreacted or dimerized probes are degraded by exonuclease treatment, preserving circularized ones. (B) Circularized probes at any locus serve as templates in a PCR with one primer specific for the common sequence (black) and two allele-specific primers, labeled with either FITC for allele 1 (green primer, marked F) or TAMRA for allele 2 (red primer, marked T). PCR products are then denatured and applied to a DNA microarray with complementary tag sequences, guiding the labeled strands to their corresponding positions. An overlaid scanning image is shown from an analysis of one individual (red color, TAMRA; green color, FITC; a combination of TAMRA and FITC appears as yellow). The spot position key identifies the investigated loci. Numbers represent locus nomenclature according to Petrukhin et al. (19).
Figure 2
Figure 2
(Opposite) Results from parallel gene analysis. (A) Seventy-five individuals were genotyped at 13 loci. Signal intensities from FITC- and TAMRA-labeled PCR products were plotted on logarithmic x- and y-axes, respectively. Locus identities are shown in the lower left corners. Individuals with confirmed genotypes that were homozygous for allele 1 at any locus are identified by green squares, homozygotes for allele 2 by red squares and heterozygotes by yellow squares. Blue diamonds represent individuals that have not been investigated by other genotyping techniques. Oligonucleotide targets representing all homozygous genotypes were also assayed, and included in the graphs if any of the homozygous genotypes were not represented in our set of samples (triangles). (B) Parallel genotyping of cDNA samples (open squares and triangles) from two liver necropsies and the corresponding genomic samples (filled squares and triangles). The results from two loci are plotted with the results from 75 genomic samples (A) shown as shaded diamonds to indicate the genotype clusters.
Figure 3
Figure 3
Effect on signal strength when more probes are analyzed. Constant amounts of circularized probes representing the three possible genotypes at the 1216 locus were mixed with increasing amounts of circularized competitor probes from the 12 other loci. Green and red diamonds represent the homozygous G and T alleles, respectively, while black diamonds represent heterozygotes. The ratios of competitor probes to those of the 1216 locus are indicated in the figure, and the corresponding genotypes are connected by lines. Error bars denote variation within each genotype. Scanner settings were optimized for the 1216 homozygous signals in the 50-fold reaction and the x-axis and y-axis scaled with FITC and TAMRA fluorescence intensities, respectively.

References

    1. Syvanen A.C. (2001) Accessing genetic variation: genotyping single nucleotide polymorphisms. Nature Rev. Genet., 2, 930–942. - PubMed
    1. Wang D.G., Fan,J.B., Siao,C.J., Berno,A., Young,P., Sapolsky,R., Ghandour,G., Perkins,N., Winchester,E., Spencer,J. et al. (1998) Large-scale identification, mapping and genotyping of single-nucleotide polymorphisms in the human genome. Science, 280, 1077–1082. - PubMed
    1. Patil N., Berno,A.J., Hinds,D.A., Barrett,W.A., Doshi,J.M., Hacker,C.R., Kautzer,C.R., Lee,D.H., Marjoribanks,C., McDonough,D.P. et al. (2001) Blocks of limited haplotype diversity revealed by high-resolution scanning of human chromosome 21. Science, 294, 1719–1723. - PubMed
    1. Oliphant A., Barker,D.L., Stuelpnagel,J.R. and Chee,M.S. (2002) BeadArray technology: enabling an accurate, cost-effective approach to high-throughput genotyping. Biotechniques, 32, 56–61. - PubMed
    1. Yeakley J.M., Fan,J.B., Doucet,D., Luo,L., Wickham,E., Ye,Z., Chee,M.S. and Fu,X.D. (2002) Profiling alternative splicing on fiber-optic arrays. Nat. Biotechnol., 20, 353–358. - PubMed

Publication types