. 2003 Sep 1;31(17):e105.
doi: 10.1093/nar/gng106.

Kinetic Outlier Detection (KOD) in real-time PCR

Affiliations

Kinetic Outlier Detection (KOD) in real-time PCR

Tzachi Bar et al. Nucleic Acids Res. .

Abstract

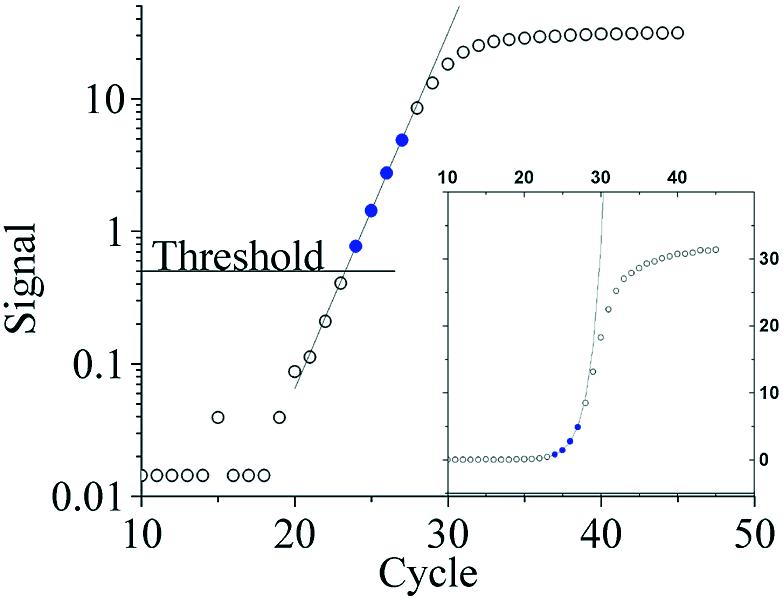
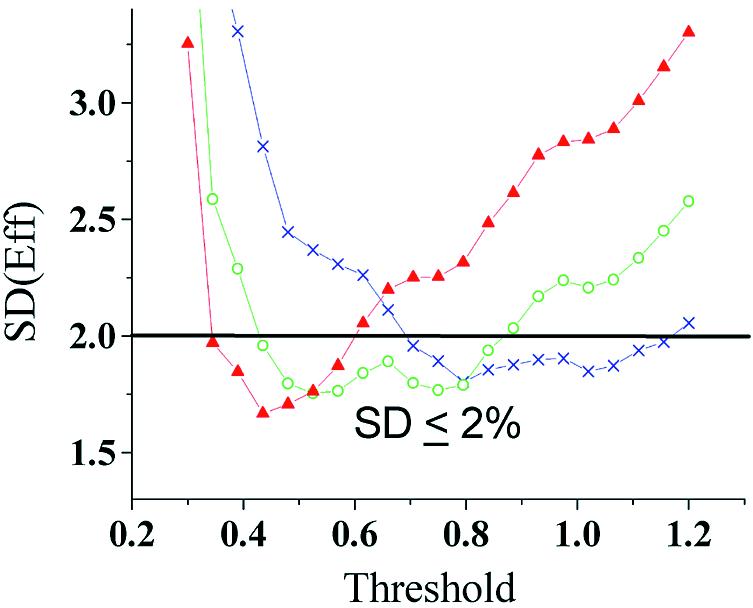
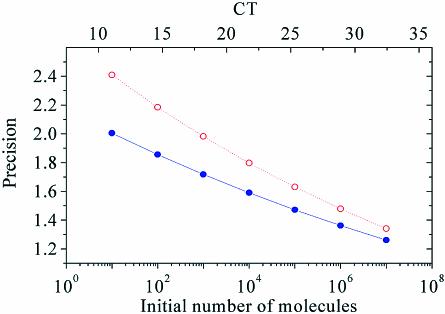
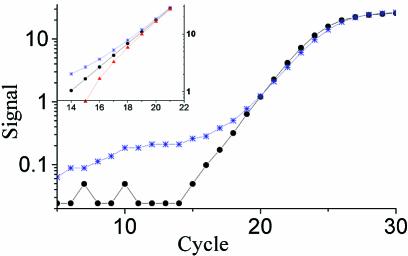
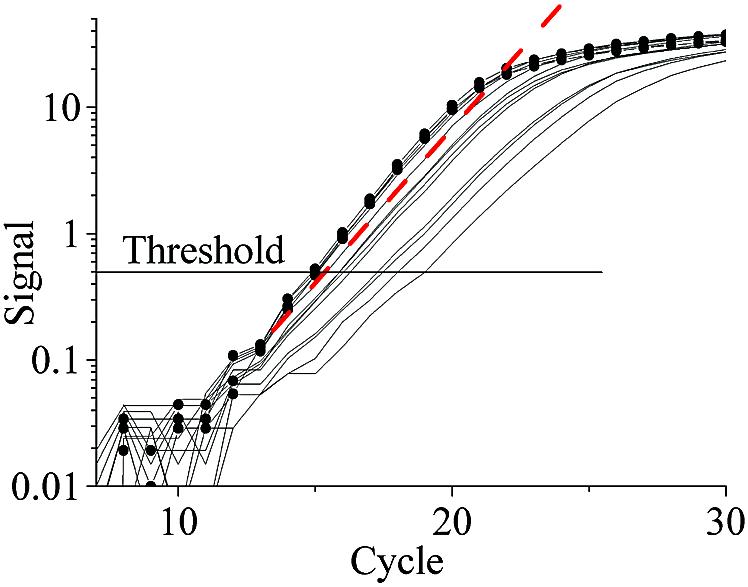
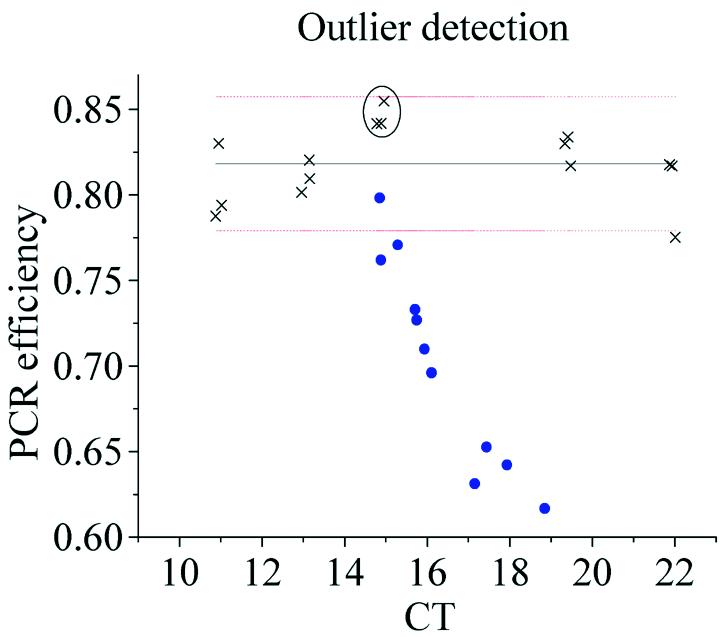
Real-time PCR is becoming the method of choice for precise quantification of minute amounts of nucleic acids. For proper comparison of samples, almost all quantification methods assume similar PCR efficiencies in the exponential phase of the reaction. However, inhibition of PCR is common when working with biological samples and may invalidate the assumed similarity of PCR efficiencies. Here we present a statistical method, Kinetic Outlier Detection (KOD), to detect samples with dissimilar efficiencies. KOD is based on a comparison of PCR efficiency, estimated from the amplification curve of a test sample, with the mean PCR efficiency of samples in a training set. KOD is demonstrated and validated on samples with the same initial number of template molecules, where PCR is inhibited to various degrees by elevated concentrations of dNTP; and in detection of cDNA samples with an aberrant ratio of two genes. Translating the dissimilarity in efficiency to quantity, KOD identifies outliers that differ by 1.3-1.9-fold in their quantity from normal samples with a P-value of 0.05. This precision is higher than the minimal 2-fold difference in number of DNA molecules that real-time PCR usually aims to detect. Thus, KOD may be a useful tool for outlier detection in real-time PCR.


Figures

Figure 1
Figure 1
Estimation of PCR efficiency by exponential fit. Three to five data points (filled circles) above threshold level are fitted by an exponential equation 1 to estimate PCR efficiency. Main frame: semi-logarithmic scale, inset: linear scale.
Figure 2
Figure 2
The PCR efficiencies of 330 samples from 25 training sets based on purified PCR product were estimated by exponential fit of three (crosses), four (circles), or five (triangles) data points above different threshold levels. The S.D. of PCR efficiency was calculated for each training set at every setting and the average values of the 25 sets are shown. The optimal range of settings includes all the settings corresponding to the crosses/circles/triangles below the horizontal line of S.D. = 0.02.
Figure 3
Figure 3
To translate the dissimilarity in efficiency that KOD identifies to minimal error in quantification, the following representative values were applied to equations 3 and 5: RCT corresponding to 1010 molecules (for SYBR Green I) (18), E = 0.9, S.D. = 0.02 (filled circles), S.D. = 0.025 (open circles). Precision of 1 means no error in quantification.
Figure 4
Figure 4
Effect of improper background subtraction on the shape of the amplification curve. Data points from a sample with properly subtracted background (filled circles) fall on a straight line in the exponential phase of the amplification curve, while under background subtracted (stars) and over background subtracted amplification curves (triangles, inset only) form concave and convex shapes, respectively.
Figure 5
Figure 5
Effect of PCR inhibition on CT and slope of amplification curve of uninhibited (circles) and inhibited (solid line) samples with equal starting number of template molecules from the dNTP titration experiment. The inhibited samples have flatter slope and reach the threshold later. Dashed lines indicate the confidence interval with slope and CT of minimally detected outliers.
Figure 6
Figure 6
Dilution series of purified PCR product was used as a training set (crosses) for outlier detection in test samples (circles) containing equal starting numbers of template molecules as the encircled concentration in the dilution series, but with elevated concentrations of dNTP as inhibitor. PCR efficiency was estimated by exponential fit in the optimal range of setting and plotted versus CT. The central line is the mean and the dotted lines indicate 95% confidence interval of the efficiency.

Similar articles

Cited by

References

    1. Livak K.J. (1997) ABI Prism 7700 Sequence Detection System, User Bulletin 2. PE Applied Biosystems.
    1. Pfaffl M.W. (2001) A new mathematical model for relative quantification in real-time RT–PCR. Nucleic Acids Res., 29, e45. - PMC - PubMed
    1. Gentle A., Anastasopoulos,F. and McBrien,N.A. (2001) High-resolution semi-quantitative real-time PCR without the use of a standard curve. Biotechniques, 31, 502, 504,–506, 508. - PubMed
    1. Wilson I.G. (1997) Inhibition and facilitation of nucleic acid amplification. Appl. Environ. Microbiol., 63, 3741–3751. - PMC - PubMed
    1. Wiedbrauk D.L., Werner,J.C. and Drevon,A.M. (1995) Inhibition of PCR by aqueous and vitreous fluids. J. Clin. Microbiol., 33, 2643–2646. - PMC - PubMed

Publication types