. 2003 Sep;12(9):1865-71.
doi: 10.1110/ps.0350503.

Matthews coefficient probabilities: Improved estimates for unit cell contents of proteins, DNA, and protein-nucleic acid complex crystals

Affiliations

Matthews coefficient probabilities: Improved estimates for unit cell contents of proteins, DNA, and protein-nucleic acid complex crystals

Katherine A Kantardjieff et al. Protein Sci. 2003 Sep.

Abstract

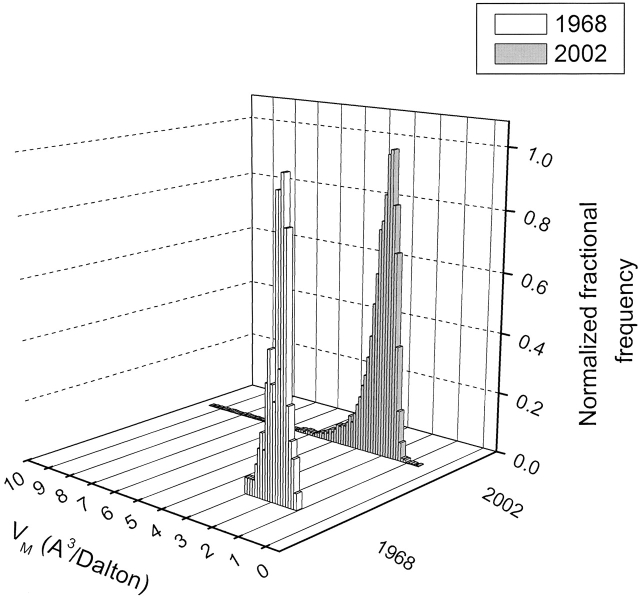
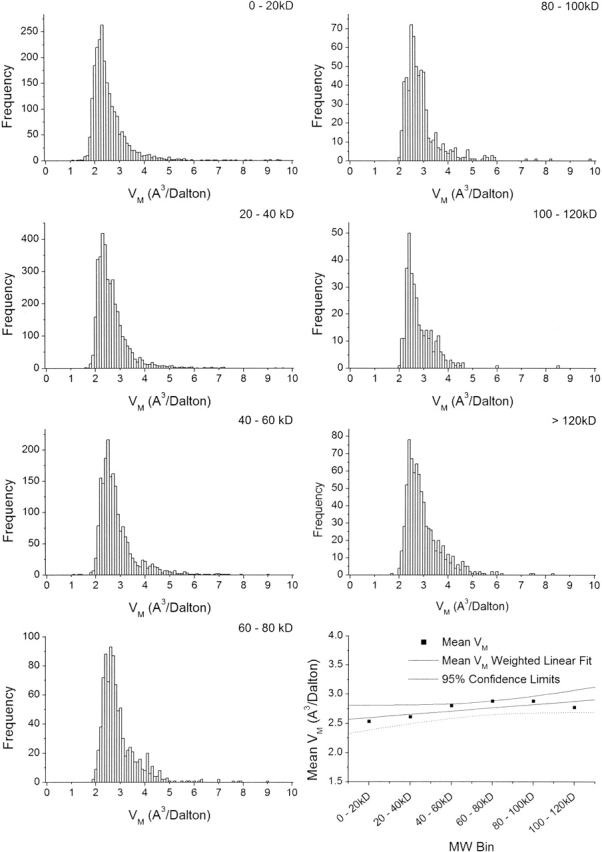
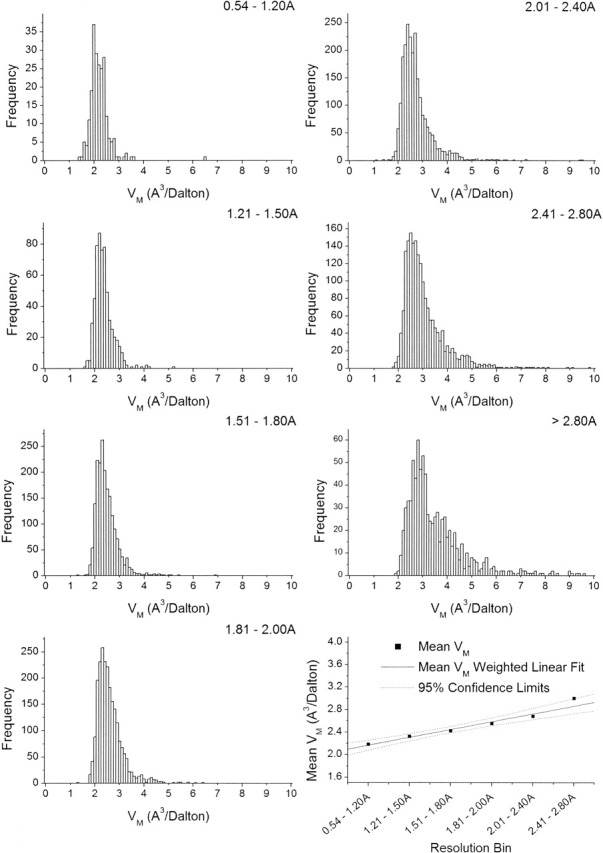
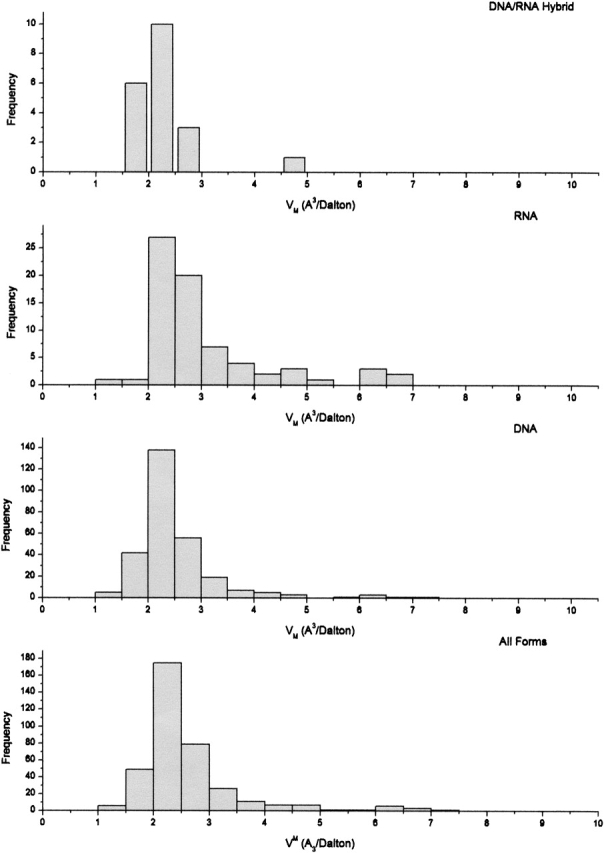
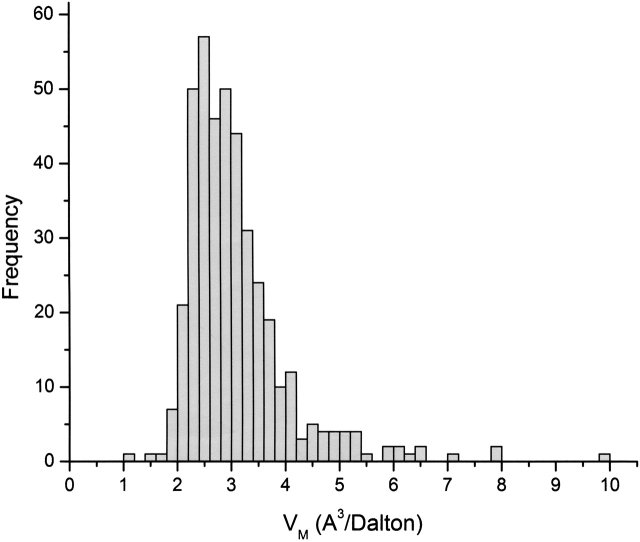
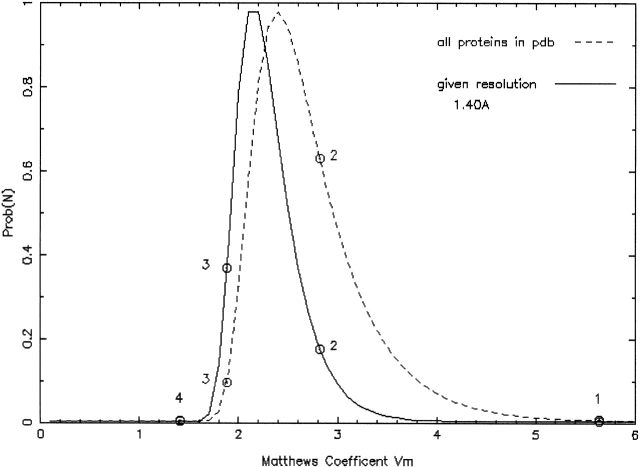
Estimating the number of molecules in the crystallographic asymmetric unit is one of the first steps in a macromolecular structure determination. Based on a survey of 15641 crystallographic Protein Data Bank (PDB) entries the distribution of V(M), the crystal volume per unit of protein molecular weight, known as Matthews coefficient, has been reanalyzed. The range of values and frequencies has changed in the 30 years since Matthews first analysis of protein crystal solvent content. In the statistical analysis, complexes of proteins and nucleic acids have been treated as a separate group. In addition, the V(M) distribution for nucleic acid crystals has been examined for the first time. Observing that resolution is a significant discriminator of V(M), an improved estimator for the probabilities of the number of molecules in the crystallographic asymmetric unit has been implemented, using resolution as additional information.


Figures

Figure 1.
Figure 1.
Frequency distribution of values observed for VM. Data taken from Matthews 1968 and from 10,471 nonredundant protein crystal forms from the November 2002 release of the Protein Data Bank. Data from Matthews 1968 have been normalized to the same scale by dividing each bin by the highest frequency value bin.
Figure 2.
Figure 2.
Frequency distributions for VM of 10,471 crystal forms of proteins in the November 2002 release of the Protein Data Bank in equal intervals by molecular weight. Plot at lower right shows mean for each frequency distribution, linear regression weighted by standard deviation, and confidence interval (95%). Correlation (R2 = 0.57), confidence limits, and P-value (0.081) show that the relationship between molecular weight and VM is not statistically significant.
Figure 3.
Figure 3.
Frequency distributions of VM for 10,471 crystal forms of proteins in discriminant resolution bins. It is evident that more tightly packed crystals (lower VM) tend to diffract to higher resolution. Graph at lower right shows mean for each frequency distribution, linear regression weighted by standard deviation, and confidence interval (95%). From the correlation (R2 = 0.97), confidence limits, and P-value (0.0009), the relationship between resolution and VM is statistically significant.
Figure 4.
Figure 4.
Frequency distribution of VM for 372 crystal forms of nucleic acids in the November 2002 release of the Protein Data Bank. DNA data set used for Matthews probability calculator contains 281 records.
Figure 5.
Figure 5.
Frequency distribution of VM for 410 crystals of protein–nucleic acid complexes in the November 2002 release of the Protein Data Bank.
Figure 6.
Figure 6.
Prediction of number of subunits in crystallographic asymmetric unit cell. Shown is estimate of number of subunits of a given protein with (full line) and without (dashed line) consideration of resolution as a predictive discriminator. The probabilities for the occurrence of a dimer versus a trimer in the asymmetric unit significantly reverse from about 4:1 (favoring a dimer) to 1:2 in favor of a trimer when the high resolution of the data is taken into consideration. Monomer and tetramer (at the right and left extremes of the distribution, respectively) are highly unlikely to occur regardless of resolution. Figure created by http://www-structure.llnl.gov/mattprob/.

References

    1. Arakawa, T. and Timasheff, S.N. 1985. Calculation of the partial specific volume of proteins in concentrated salt and amino acid solutions. Methods Enzymol. 117 60–65. - PubMed
    1. Berman, H.M., Westbrook, J., Feng, Z., Gilliland, G., Bhat, T.N., Weissig, H., Shindyalov, I.N., and Bourne, P. 2000. The Protein Data Bank. Nucleic Acids Res. 28 235–242. - PMC - PubMed
    1. Cohen, G. and Eisenberg, H. 1968. Deoxyribonucleate solutions: Sedimentation in a density gradient, partial specific volumes, density and refractive index increments, and preferential interactions. Biopolymers 6 1077–1100. - PubMed
    1. Durchschlag, H. and Zipper, P. 1994. Calculation of the partial volume of organic compounds and polymers. Prog. Colloid Polym. Sci. 94 20–39.
    1. Hartigan, J. 1975. Clustering algorithms. Wiley, New York.

Publication types