The solution structure of bovine pancreatic trypsin inhibitor at high pressure
- PMID: 12930996
- PMCID: PMC2323994
- DOI: 10.1110/ps.0242103
The solution structure of bovine pancreatic trypsin inhibitor at high pressure
Abstract
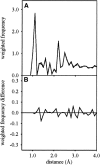
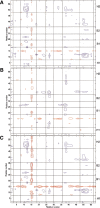
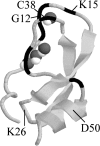
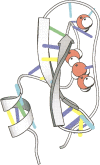
The solution structure of bovine pancreatic trypsin inhibitor (BPTI) at a pressure of 2 kbar is presented. The structure was calculated as a change from an energy-minimized low-pressure structure, using (1)H chemical shifts as restraints. The structure has changed by 0.24 A RMS, and has almost unchanged volume. The largest changes as a result of pressure are in the loop 10-16, which contains the active site of BPTI, and residues 38-42, which are adjacent to buried water molecules. Hydrogen bonds are compressed by 0.029 +/- 0.117 A, with the longer hydrogen bonds, including those to internal buried water molecules, being compressed more. The hydrophobic core is also compressed, largely from reduction of packing defects. The parts of the structure that have the greatest change are close to buried water molecules, thus highlighting the importance of water molecules as the nucleation sites for volume fluctuation of proteins in native conditions.
Figures


Similar articles
-
High-resolution structure of bovine pancreatic trypsin inhibitor with altered binding loop sequence.J Mol Biol. 2000 Feb 4;295(5):1237-49. doi: 10.1006/jmbi.1999.3445. J Mol Biol. 2000. PMID: 10653700
-
Residence times of the buried water molecules in bovine pancreatic trypsin inhibitor and its G36S mutant.Biochemistry. 1995 Jul 18;34(28):9046-51. doi: 10.1021/bi00028a013. Biochemistry. 1995. PMID: 7542475
-
Structure of single-disulfide variants of bovine pancreatic trypsin inhibitor (BPTI) as probed by their binding to bovine beta-trypsin.J Mol Biol. 1998 Jan 23;275(3):503-13. doi: 10.1006/jmbi.1997.1460. J Mol Biol. 1998. PMID: 9466927
-
Protein hydration in aqueous solution.Faraday Discuss. 1992;(93):35-45. doi: 10.1039/fd9929300035. Faraday Discuss. 1992. PMID: 1283962 Review.
-
Accurate simulation of protein dynamics in solution.Proc Natl Acad Sci U S A. 1988 Oct;85(20):7557-61. doi: 10.1073/pnas.85.20.7557. Proc Natl Acad Sci U S A. 1988. PMID: 2459709 Free PMC article. Review.
Cited by
-
Protein-Ligand Binding Volume Determined from a Single 2D NMR Spectrum with Increasing Pressure.J Phys Chem B. 2021 Jun 10;125(22):5823-5831. doi: 10.1021/acs.jpcb.1c02917. Epub 2021 May 25. J Phys Chem B. 2021. PMID: 34032445 Free PMC article.
-
Theoretical study of the partial molar volume change associated with the pressure-induced structural transition of ubiquitin.Protein Sci. 2007 Sep;16(9):1927-33. doi: 10.1110/ps.072909007. Epub 2007 Jul 27. Protein Sci. 2007. PMID: 17660257 Free PMC article.
-
Pushed to extremes: distinct effects of high temperature versus pressure on the structure of STEP.Commun Biol. 2024 Jan 12;7(1):59. doi: 10.1038/s42003-023-05609-0. Commun Biol. 2024. PMID: 38216663 Free PMC article.
-
Structural change in a B-DNA helix with hydrostatic pressure.Nucleic Acids Res. 2008 Jul;36(12):4032-7. doi: 10.1093/nar/gkn350. Epub 2008 May 31. Nucleic Acids Res. 2008. PMID: 18515837 Free PMC article.
-
Pressure-dependent 13C chemical shifts in proteins: origins and applications.J Biomol NMR. 2009 May;44(1):25-33. doi: 10.1007/s10858-009-9312-4. Epub 2009 Mar 24. J Biomol NMR. 2009. PMID: 19308328
References
-
- Akasaka, K. and Li, H. 2001. Low-lying excited states of proteins revealed from nonlinear pressure shifts in 1H and 15N NMR. Biochemistry 40 8665–8671. - PubMed
-
- Akasaka, K. and Yamada, H. 2001. On-line cell high-pressure nuclear magnetic resonance technique: Application to protein studies. Methods Enzymol. 338 134–158. - PubMed
-
- Asakura, T., Taoka, K., Demura, M., and Williamson, M.P. 1995. The relationship between amide proton chemical shifts and secondary structure in proteins. J. Biomol. NMR 6 227–236. - PubMed
-
- Bailey, S. 1994. The CCP4 suite: Programs for crystallography. Acta. Cryst. D50 760–763. - PubMed
-
- Baxter, N.J. and Williamson, M.P. 1997. Temperature dependence of 1H chemical shifts in proteins. J. Biomol. NMR 9 359–369. - PubMed
Publication types
MeSH terms
Substances
LinkOut - more resources
Full Text Sources

