

Contact order revisited: influence of protein size on the folding rate
- PMID: 12931003
- PMCID: PMC2324001
- DOI: 10.1110/ps.0302503
Contact order revisited: influence of protein size on the folding rate
Abstract
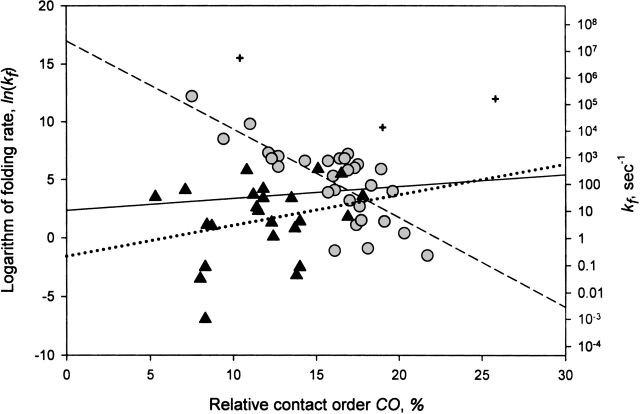
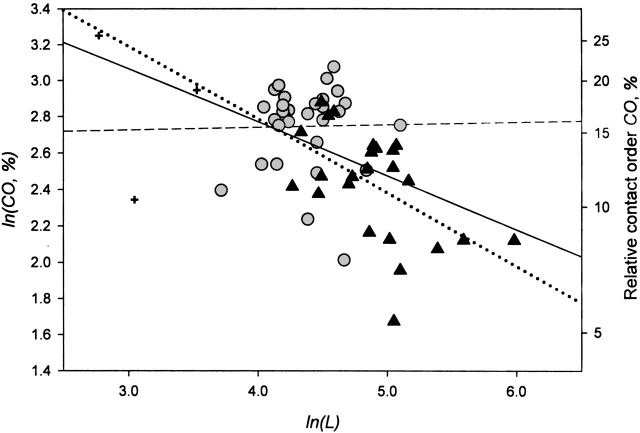
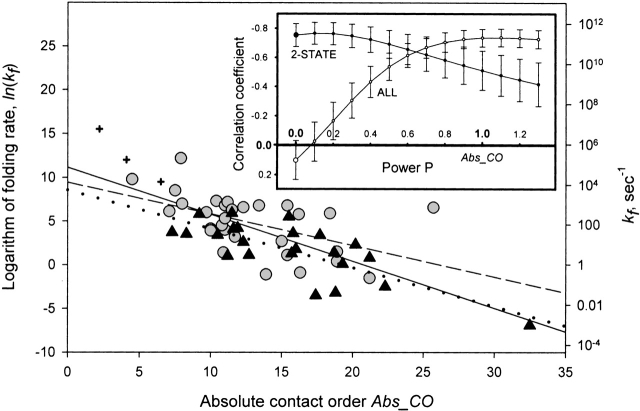
Guided by the recent success of empirical model predicting the folding rates of small two-state folding proteins from the relative contact order (CO) of their native structures, by a theoretical model of protein folding that predicts that logarithm of the folding rate decreases with the protein chain length L as L(2/3), and by the finding that the folding rates of multistate folding proteins strongly correlate with their sizes and have very bad correlation with CO, we reexamined the dependence of folding rate on CO and L in attempt to find a structural parameter that determines folding rates for the totality of proteins. We show that the Abs_CO = CO x L, is able to predict rather accurately folding rates for both two-state and multistate folding proteins, as well as short peptides, and that this Abs_CO scales with the protein chain length as L(0.70 +/- 0.07) for the totality of studied single-domain proteins and peptides.
Figures
Similar articles
-
Topological determinants of protein unfolding rates.Proteins. 2005 Feb 1;58(2):389-95. doi: 10.1002/prot.20324. Proteins. 2005. PMID: 15558603
-
Cooperativity in two-state protein folding kinetics.Protein Sci. 2004 Mar;13(3):822-9. doi: 10.1110/ps.03403604. Protein Sci. 2004. PMID: 14978313 Free PMC article.
-
On the role of structural class of a protein with two-state folding kinetics in determining correlations between its size, topology, and folding rate.Protein Sci. 2007 Nov;16(11):2564-9. doi: 10.1110/ps.073124507. Protein Sci. 2007. PMID: 17962408 Free PMC article.
-
Understanding the folding rates and folding nuclei of globular proteins.Curr Protein Pept Sci. 2007 Dec;8(6):521-36. doi: 10.2174/138920307783018695. Curr Protein Pept Sci. 2007. PMID: 18220841 Review.
-
Fast kinetics and mechanisms in protein folding.Annu Rev Biophys Biomol Struct. 2000;29:327-59. doi: 10.1146/annurev.biophys.29.1.327. Annu Rev Biophys Biomol Struct. 2000. PMID: 10940252 Free PMC article. Review.
Cited by
-
Effects of Residual Composition and Distribution on the Structural Characteristics of the Protein.Int J Mol Sci. 2022 Nov 17;23(22):14263. doi: 10.3390/ijms232214263. Int J Mol Sci. 2022. PMID: 36430742 Free PMC article.
-
Energy landscape analysis of native folding of the prion protein yields the diffusion constant, transition path time, and rates.Proc Natl Acad Sci U S A. 2012 Sep 4;109(36):14452-7. doi: 10.1073/pnas.1206190109. Epub 2012 Aug 20. Proc Natl Acad Sci U S A. 2012. PMID: 22908253 Free PMC article.
-
Spontaneous refolding of the large multidomain protein malate synthase G proceeds through misfolding traps.J Biol Chem. 2018 Aug 24;293(34):13270-13283. doi: 10.1074/jbc.RA118.003903. Epub 2018 Jun 29. J Biol Chem. 2018. PMID: 29959230 Free PMC article.
-
An assembly funnel makes biomolecular complex assembly efficient.PLoS One. 2014 Oct 31;9(10):e111233. doi: 10.1371/journal.pone.0111233. eCollection 2014. PLoS One. 2014. PMID: 25360818 Free PMC article.
-
Folding and Stability of Ankyrin Repeats Control Biological Protein Function.Biomolecules. 2021 Jun 5;11(6):840. doi: 10.3390/biom11060840. Biomolecules. 2021. PMID: 34198779 Free PMC article. Review.
References
-
- Bernstein, F.C., Koetzle, T.F., Williams, G.J.B., Meyer, E.F., Brice, M.D., Rogers, J.R., Kennard, O., Shimanouchi, T., and Tasumi, M. 1977. The Protein Bank: A computer-based archival file for macromolecular structures. Eur. J. Biochem. 80 319–324. - PubMed
-
- Burns, L.L., Dalessio, P.M., and Ropson, I.J. 1998. Folding mechanism of three structurally similar β-sheet proteins. Proteins 33 107–118. - PubMed
-
- Burton, R.E., Huang, G.S., Daugherty, M.A., Fullbright, P.W., and Oas, T.G. 1996. Microsecond protein folding through a compact transition state. J. Mol. Biol. 263 311–322. - PubMed
-
- Cavagnero, S., Dyson, H.J., and Wright, P.E. 1999. Effect of H helix destabilizing mutations on the kinetic and equilibrium folding of apomyoglobin. J. Mol. Biol. 285 269–282. - PubMed
-
- Choe, S.E., Matsudaira, P.T., Osterhout, J., Wagner, G., and Shakhnovich, E.I. 1998. Folding kinetics of villin 14T, a protein domain with a central β-sheet and two hydrophobic cores. Biochemistry 37 14508–14518. - PubMed
Publication types
MeSH terms
Substances
LinkOut - more resources
Full Text Sources
Other Literature Sources
Research Materials
