. 2003 Aug;18(4):339-50.
doi: 10.1177/0748730403253840.

Gates and oscillators: a network model of the brain clock

Affiliations

Gates and oscillators: a network model of the brain clock

Michael C Antle et al. J Biol Rhythms. 2003 Aug.

Erratum in

  • J Biol Rhythms. 2004 Jun;19(3):258

Abstract

The suprachiasmatic nuclei (SCN) control circadian oscillations of physiology and behavior. Measurements of electrical activity and of gene expression indicate that these heterogeneous structures are composed of both rhythmic and nonrhythmic cells. A fundamental question with regard to the organization of the circadian system is how the SCN achieve a coherent output while their constituent independent cellular oscillators express a wide range of periods. Previously, the consensus output of individual oscillators had been attributed to coupling among cells. The authors propose a model that incorporates nonrhythmic "gate" cells and rhythmic oscillator cells with a wide range of periods, that neither requires nor excludes a role for interoscillator coupling. The gate provides daily input to oscillator cells and is in turn regulated (directly or indirectly) by the oscillator cells. In the authors' model, individual oscillators with initial random phases are able to self-assemble so as to maintain cohesive rhythmic output. In this view, SCN circuits are important for self-sustained oscillation, and their network properties distinguish these nuclei from other tissues that rhythmically express clock genes. The model explains how individual SCN cells oscillate independently and yet work together to produce a coherent rhythm.


Figures
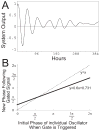
Figure 1
Figure 1
A) Simulation of 100 oscillators randomly selected from a population with a mean period of 24 h and a standard deviation of 3 h. All oscillators start with a phase between 0 and π/4. Output quickly damps and becomes arrhythmic without a daily reinitiating signal. B) Graph indicates how the phase of an individual oscillator is reset following a signal from the gate. Phase is indicated over a range from 0 to 2π along both the x and the y axis. The dashed line represents the function for no change in phase. The solid line represents the resetting function employed in all simulations. The resetting function used has a slope of 0.6 and intersects the null function at 7π/12.
Figure 2
Figure 2
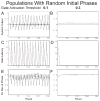
Simulation demonstrating the self-assembly of a population of 1000 oscillators with a mean period of 24 h and a standard deviation of 3 h. Initial phase for each oscillator was randomly distributed between 0 and 2π. These simulations include a gate that is triggered when the output of the ensemble of oscillators reaches a defined threshold. A) Simulation with gate threshold set at 0.1. The system self-assembles and maintains rhythmic output with a circadian period. Dotted line represents threshold of activation level. B) A simulation with the same population of oscillators used in A, but with the gate threshold set at 0.3. Dotted line represents threshold of activation level. C) Gate latency for A. The gate has been designed to enter a 20-h inactive phase after each time it is triggered. It is inactive for the first 15 h of the simulation. These latencies prevent the gate from being triggered by above threshold output more than once a cycle. D) Latency for simulation B. E) Standard deviation in phase of all the oscillators in simulation A. F) Standard deviation in phase of all the oscillators in simulation B.
Figure 3
Figure 3
Simulations examining the effects of different thresholds of activation on the output of the ensemble of oscillators. Each simulation is run with 1000 oscillators from a population with a mean period of 24 h and a standard deviation of 3 h. The initial phase of each oscillator is randomly set between 0 and π/4. The thresholds used were 0.1, 0.3, and 0.5. Gray lines represent threshold of activation levels. The gate cannot maintain phase coherence of the oscillators with a threshold of 0.5 but manages to keep the system oscillating with a threshold of either 0.1 or 0.3.
Figure 4
Figure 4
Simulations examining the effects of different amounts of variability in the periods of the oscillators. Each simulation is run with 1000 oscillators from a population with a mean period of 24 h and a standard deviation of 1, 3, or 6 h. The initial phase of each oscillator is randomly set between 0 and π/4. For the 1st 3 simulations, the threshold is set at 0.3. The gate maintains phase coherence in the ensemble when the standard deviation is either 1 or 3 h, but it fails to maintain rhythmic output with a standard deviation of 6 h.
Figure 5
Figure 5
Simulations examining the behavior of an ensemble with a large variability in period among oscillators. Each simulation is run with 1000 oscillators from a population with a mean period of 24 h and a standard deviation of 6 h. The initial phase of each oscillator is randomly set between 0 and π/4. For the first and last simulations, the threshold is set at 0.3, and for the middle simulation, the threshold is set at 0.1. Dotted lines represent threshold of activation levels. In the 1st 2 simulations, the resetting function has a slope of 0.6, while in the final simulation it has a slope of 0.4. In all cases, it intercepts with the null resetting function at 7π/12. The 1st simulation is repeated from the last simulation of Figure 5, and in this simulation the gate fails to maintain phase coherence. When the threshold is lowered to 0.1, the gate maintains rhythmic output for 9 cycles, after which it is lost briefly, but recovered. If instead the slope of the resetting function is changed, this also allows the gate to maintain rhythmic output.

References

    1. Bryant DN, LeSauter J, Silver R, Romero MT. Retinal innervation of calbindin-D28K cells in the hamster suprachiasmatic nucleus: ultrastructural characterization. J Biol Rhythms. 2000;15:103–111. - PMC - PubMed
    1. Colwell CS. Rhythmic coupling among cells in the suprachiasmatic nucleus. J Neurobiol. 2000;43:379–388. - PMC - PubMed
    1. Davis FC, Gorski RA. Development of hamster circadian rhythms: role of the maternal suprachiasmatic nucleus. J Comp Physiol [A] 1988;162:601–610. - PubMed
    1. Davis FC, Viswanathan N. Stability of circadian timing with age in Syrian hamsters. Am J Physiol. 1998;275:R960–R968. - PubMed
    1. Dudley TE, DiNArdo LA, Glass JD. Endogenous regulation of serotonin release in the hamster supra-chiasmatic nucleus. J Neurosci. 1998;18:5045–5052. - PMC - PubMed

Publication types

LinkOut - more resources