

High CXCR3 expression in synovial mast cells associated with CXCL9 and CXCL10 expression in inflammatory synovial tissues of patients with rheumatoid arthritis
- PMID: 12932287
- PMCID: PMC193722
- DOI: 10.1186/ar783
High CXCR3 expression in synovial mast cells associated with CXCL9 and CXCL10 expression in inflammatory synovial tissues of patients with rheumatoid arthritis
Abstract
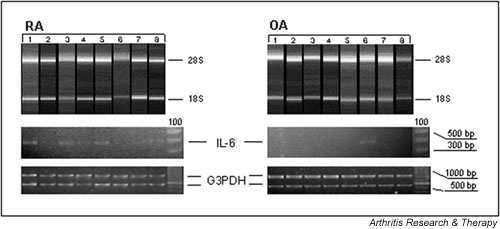
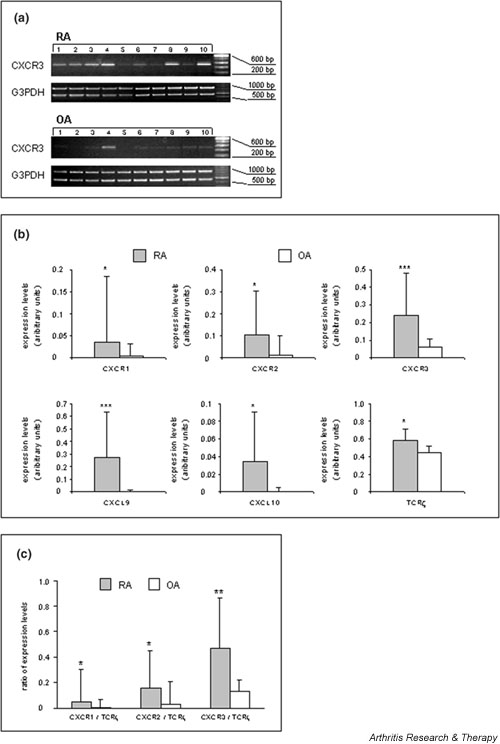
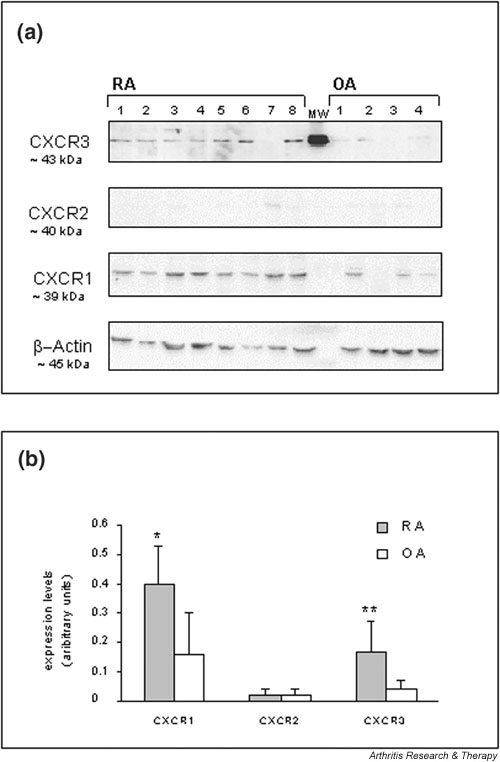
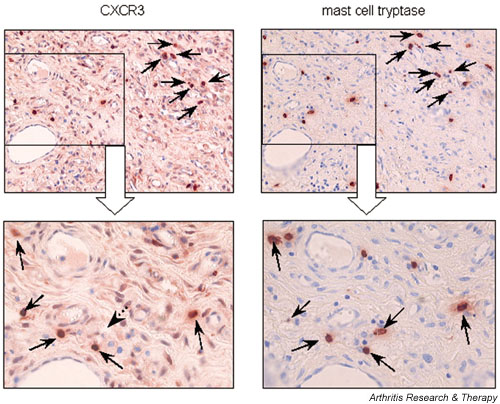
To improve our knowledge on the pathophysiology of rheumatoid arthritis (RA), we investigated gene expression patterns in synovial tissue from RA and osteoarthritis (OA) patients. DNA oligonucleotide microarray analysis was employed to identify differentially expressed genes in synovial tissue from pathologically classified tissue samples from RA (n = 20) and OA patients (n = 10). From 7131 gene sets displayed on the microarray chip, 101 genes were found to be upregulated and 300 genes to be downregulated in RA as compared with OA. Semiquantitative reverse-transcription polymerase chain reaction, Western blotting and immunohistochemistry were used to validate microarray expression levels. These experiments revealed that Cys-X-Cys receptor (CXCR)1, CXCR2 and CXCR3 mRNAs, as well as Cys-X-Cys ligand (CXCL)9 (monokine induced by IFN-gamma) and CXCL10 (IFN-gamma inducible protein 10) mRNAs, were significantly upregulated in RA as compared with OA disease. Elevated protein levels in RA synovial tissue were detected for CXCR1 and CXCR3 by Western blotting. Using immunohistochemistry, CXCR3 protein was found to be preferentially expressed on mast cells within synovial tissue from RA patients. These findings suggest that substantial expression of CXCR3 protein on mast cells within synovial tissue from RA patients plays a significant role in the pathophysiology of RA, accompanied by elevated levels of the chemokines CXCL9 and CXCL10. Mature mast cells are likely to contribute to and sustain the inflamed state in arthritic lesions (e.g. by production of inflammatory mediators such as histamine, proteinases, arachidonic acid metabolites and cytokines). Thus, the mast cell could become a potential target in therapeutic intervention.
Figures
Similar articles
-
The production of CXCR3-agonistic chemokines by synovial fibroblasts from patients with rheumatoid arthritis.Rheumatol Int. 2005 Jun;25(5):361-7. doi: 10.1007/s00296-004-0449-x. Epub 2004 Mar 5. Rheumatol Int. 2005. PMID: 15004722
-
Differential expression of chemokine receptors on peripheral blood, synovial fluid, and synovial tissue monocytes/macrophages in rheumatoid arthritis.Arthritis Rheum. 2001 May;44(5):1022-32. doi: 10.1002/1529-0131(200105)44:5<1022::AID-ANR181>3.0.CO;2-N. Arthritis Rheum. 2001. PMID: 11352233
-
Synergistic induction of CXCL9 and CXCL11 by Toll-like receptor ligands and interferon-gamma in fibroblasts correlates with elevated levels of CXCR3 ligands in septic arthritis synovial fluids.J Leukoc Biol. 2004 May;75(5):777-84. doi: 10.1189/jlb.1003524. Epub 2004 Mar 2. J Leukoc Biol. 2004. PMID: 14996826
-
Chemokine (C-X-C motif) ligand (CXCL)10 in autoimmune diseases.Autoimmun Rev. 2014 Mar;13(3):272-80. doi: 10.1016/j.autrev.2013.10.010. Epub 2013 Nov 2. Autoimmun Rev. 2014. PMID: 24189283 Review.
-
Arthritic and non-arthritic synovial fluids modulate IL10 and IL1RA gene expression in differentially activated primary human monocytes.Osteoarthritis Cartilage. 2015 Nov;23(11):1853-7. doi: 10.1016/j.joca.2015.06.003. Osteoarthritis Cartilage. 2015. PMID: 26521731 Review.
Cited by
-
Association between IL-33 and other inflammatory factors in patients with rheumatoid arthritis and in fibroblast-like synoviocytes in vitro.Exp Ther Med. 2021 Feb;21(2):161. doi: 10.3892/etm.2020.9592. Epub 2020 Dec 18. Exp Ther Med. 2021. PMID: 33456528 Free PMC article.
-
Chronic inflammatory lesions of the placenta are associated with an up-regulation of amniotic fluid CXCR3: A marker of allograft rejection.J Perinat Med. 2018 Feb 23;46(2):123-137. doi: 10.1515/jpm-2017-0042. J Perinat Med. 2018. PMID: 28829757 Free PMC article.
-
CXCL9 and CXCL10 gene polymorphisms in patients with rheumatoid arthritis.Rheumatol Int. 2015 Aug;35(8):1319-23. doi: 10.1007/s00296-015-3234-0. Epub 2015 Feb 22. Rheumatol Int. 2015. PMID: 25702175
-
[Research strategies towards a holistic characterization of rheumatoid arthritis--a systems biology approach].Z Rheumatol. 2005 Sep;64(6):408-15. doi: 10.1007/s00393-005-0770-0. Z Rheumatol. 2005. PMID: 16184349 Review. German.
-
Distinct Regulation of CXCL10 Production by Cytokines in Human Salivary Gland Ductal and Acinar Cells.Inflammation. 2018 Aug;41(4):1172-1181. doi: 10.1007/s10753-018-0764-0. Inflammation. 2018. PMID: 29549479
References
Publication types
MeSH terms
Substances
LinkOut - more resources
Full Text Sources
Other Literature Sources
Medical
Research Materials
