. 2003 Sep;71(9):5042-55.
doi: 10.1128/IAI.71.9.5042-5055.2003.

Borrelia burgdorferi population dynamics and prototype gene expression during infection of immunocompetent and immunodeficient mice

Affiliations

Borrelia burgdorferi population dynamics and prototype gene expression during infection of immunocompetent and immunodeficient mice

Emir Hodzic et al. Infect Immun. 2003 Sep.

Abstract

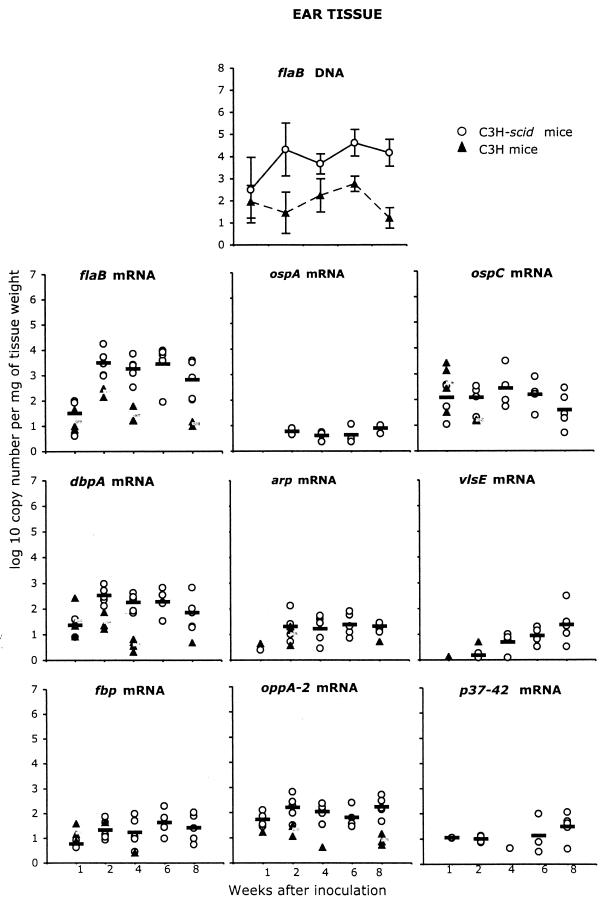
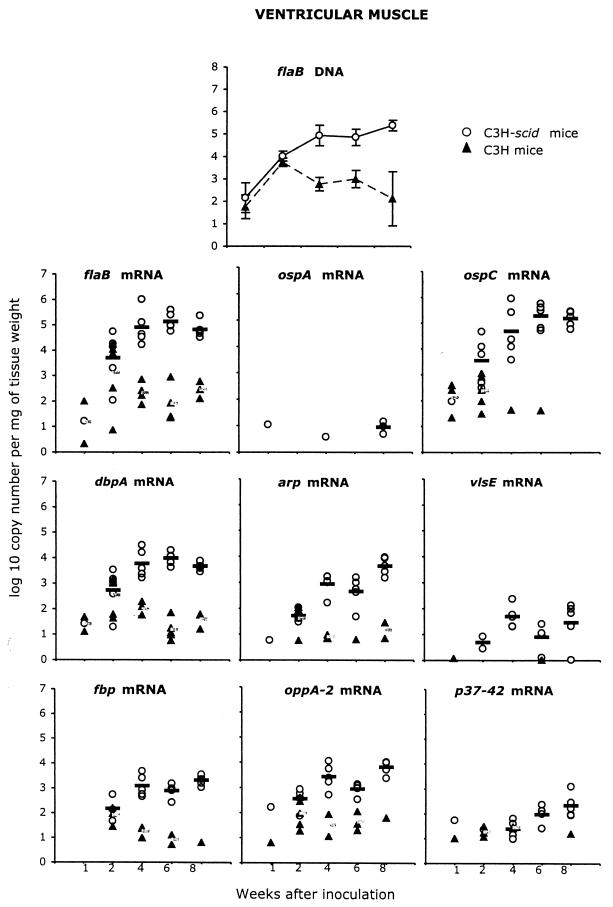
The population dynamics of Borrelia burgdorferi were quantified by real-time PCR targeting the flaB gene in skin (inoculation site, noninoculation site, and ear), heart (heart base and ventricle), quadriceps muscle, and the tibiotarsal joint at 1, 2, 4, 6, and 8 weeks after intradermal inoculation in C3H and C3H-scid mice. In addition, RNA transcription was assessed for several prototype genes, including flaB, ospA, ospC, dbpA, arp, vlsE, fbp, oppA-2, and p37-42. Spirochete numbers were equivalent in C3H and C3H-scid mice at 1 or 2 weeks and then declined in C3H mice, but they continued to rise and then plateaued in C3H-scid mice. Gene transcription was likewise higher in C3H-scid mice than in C3H mice, particularly at 4 or more weeks of infection. Gene transcription showed variation among tissues, with the highest levels of transcription in heart and joint tissue, which are sites of inflammation.


Figures

FIG. 1.
FIG. 1.
Quantitative analysis of B. burgdorferi flaB DNA (means ± standard deviations [top panel]) and flaB, ospA, ospC, dbpA, arp, vlsE, fbp, oppA-2 and p37-42 RNA in skin at the site of intradermal inoculation at 1, 2, 4, 6, and 8 weeks in C3H and C3H-scid mice. Mean RNA values are represented as horizontal bars (light bars, C3H; dark bars, C3H-scid). Values are plotted per milligram of tissue weight.
FIG. 2.
FIG. 2.
Quantitative analysis of B. burgdorferi flaB DNA (means ± standard deviations [top panel]) and flaB, ospA, ospC, dbpA, arp, vlsE, fbp, oppA-2, and p37-42 RNA in skin distant from the site of intradermal inoculation at 1, 2, 4, 6, and 8 weeks in C3H and C3H-scid mice. Mean RNA values are represented as horizontal bars (light bars, C3H; dark bars, C3H-scid). Values are plotted per milligram of tissue weight.
FIG. 3.
FIG. 3.
Quantitative analysis of B. burgdorferi flaB DNA (means ± standard deviations [top panel]) and flaB, ospA, ospC, dbpA, arp, vlsE, fbp, oppA-2, and p37-42 RNA in ear tissue at 1, 2, 4, 6, and 8 weeks after inoculation in C3H and C3H-scid mice. Mean RNA values are represented as horizontal bars (light bars, C3H; dark bars, C3H-scid). Values are plotted per milligram of tissue weight.
FIG. 4.
FIG. 4.
Quantitative analysis of B. burgdorferi flaB DNA (means ± standard deviations [top panel]) and flaB, ospA, ospC, dbpA, arp, vlsE, fbp, oppA-2, and p37-42 RNA in heart base tissue at 1, 2, 4, 6, and 8 weeks after inoculation in C3H and C3H-scid mice. Mean RNA values are represented as horizontal bars (light bars, C3H; dark bars, C3H-scid). Values are plotted per milligram of tissue weight.
FIG. 5.
FIG. 5.
Quantitative analysis of B. burgdorferi flaB DNA (means ± standard deviations [top panel]) and flaB, ospA, ospC, dbpA, arp, vlsE, fbp, oppA-2, and p37-42 RNA in cardiac ventricular muscle at 1, 2, 4, 6, and 8 weeks after inoculation in C3H and C3H-scid mice. Mean RNA values are represented as horizontal bars (light bars, C3H; dark bars, C3H-scid). Values are plotted per milligram of tissue weight.
FIG. 6.
FIG. 6.
Quantitative analysis of B. burgdorferi flaB DNA (means ± standard deviations [top panel]) and flaB, ospA, ospC, dbpA, arp, vlsE, fbp, oppA-2, and p37-42 RNA in tibiotarsal joint tissue at 1, 2, 4, 6, and 8 weeks after inoculation in C3H and C3H-scid mice. Mean RNA values are represented as horizontal bars (light bars, C3H; dark bars, C3H-scid). Values are plotted per milligram of tissue weight.
FIG. 7.
FIG. 7.
Quantitative analysis of B. burgdorferi flaB DNA (means ± standard deviations [top panel]) and flaB, ospA, ospC, dbpA, arp, vlsE, fbp, oppA-2, and p37-42 RNA in quadriceps femoris muscle tissue at 1, 2, 4, 6, and 8 weeks after inoculation in C3H and C3H-scid mice. Mean RNA values are represented as horizontal bars (light bars, C3H; dark bars, C3H-scid). Values are plotted per milligram of tissue weight.

Similar articles

Cited by

References

    1. Akins, D. R., K. W. Bourell, M. J. Caimano, M. V. Norgard, and J. D. Radolf. 1998. A new animal model for studying Lyme disease spirochetes in a mammalian host-adapted state. J. Clin. Investig. 101:2240-2250. - PMC - PubMed
    1. Akins, D. R., S. F. Porcella, T. G. Popova, D. Shevchenko, S. I. Baker, M. Li, M. V. Norgard, and J. D. Radolf. 1995. Evidence for in vivo but not in vitro expression of a Borrelia burgdorferi outer surface protein F (OspF) homologue. Mol. Microbiol. 18:507-520. - PubMed
    1. Armstrong, A. L., S. W. Barthold, D. H. Persing, and D. S. Beck. 1992. Carditis in Lyme disease susceptible and resistant strains of laboratory mice infected with Borrelia burgdorferi. Am. J. Trop. Med. Hyg. 47:249-258. - PubMed
    1. Barbour, A. G. 1984. Isolation and cultivation of Lyme disease spirochetes. Yale J. Biol. Med. 57:521-525. - PMC - PubMed
    1. Barbour, A. G., S. L. Tessier, and W. J. Todd. 1983. Lyme disease spirochetes and ixodid tick spirochetes share a common surface antigenic determinant defined by monoclonal antibody. Infect. Immun. 41:795-804. - PMC - PubMed

Publication types

MeSH terms