. 2003 Sep;71(9):5254-65.
doi: 10.1128/IAI.71.9.5254-5265.2003.

Protective mucosal Th2 immune response against Toxoplasma gondii by murine mesenteric lymph node dendritic cells

Affiliations

Protective mucosal Th2 immune response against Toxoplasma gondii by murine mesenteric lymph node dendritic cells

Isabelle Dimier-Poisson et al. Infect Immun. 2003 Sep.

Abstract

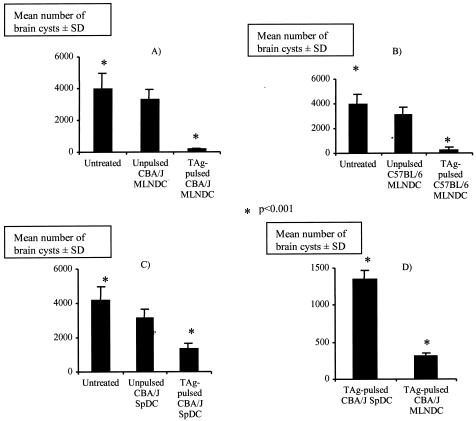
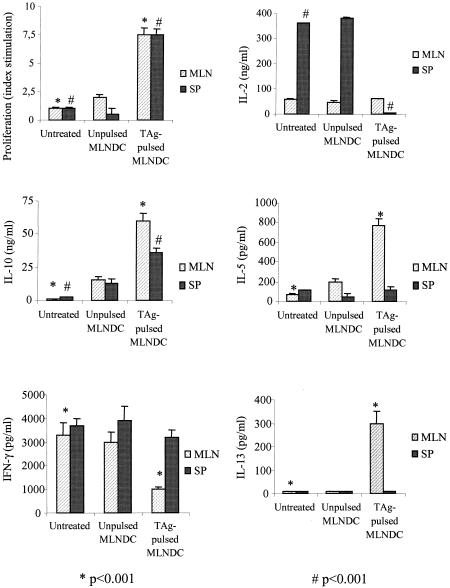
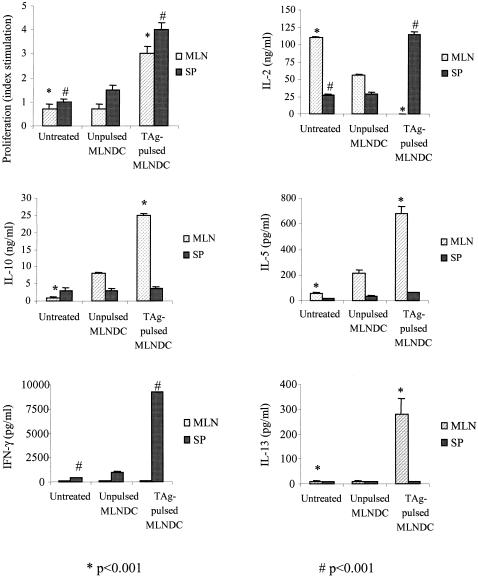
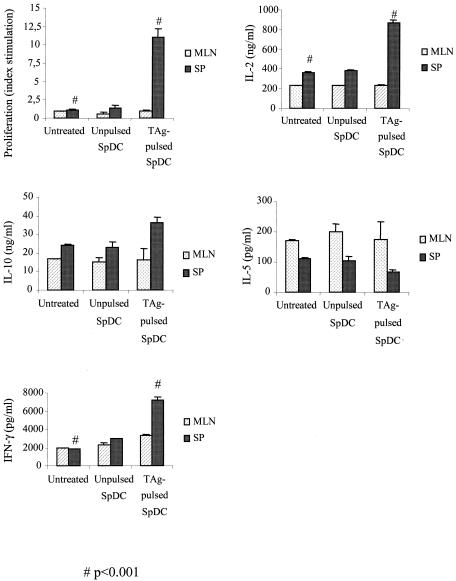
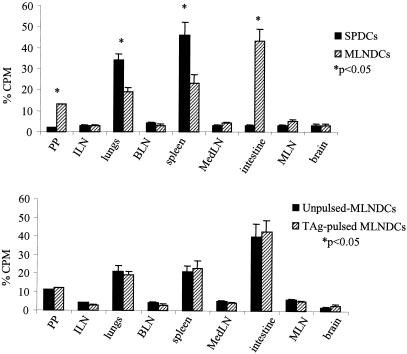
Toxoplasma gondii, an obligate intracellular parasite pathogen which initially invades the intestinal epithelium before disseminating throughout the body, may cause severe sequelae in fetuses and life-threatening neuropathy in immunocompromised patients. Immune protection is usually thought to be performed through a systemic Th1 response; considering the route of parasite entry it is important to study and characterize the local mucosal immune response to T. gondii. Despite considerable effort, Toxoplasma-targeted vaccines have proven to be elusive using conventional strategies. We report the use of mesenteric lymph node dendritic cells (MLNDCs) pulsed ex vivo with T. gondii antigens (TAg) as a novel investigation approach to vaccination against T. gondii-driven pathogenic processes. Using a murine model, we demonstrate in two genetically distinct mouse strains (C57BL/6 and CBA/J) that adoptively transferred TAg-pulsed MLNDCs elicit a mucosal Toxoplasma-specific Th2-biased immune response in vivo and confer strong protection against infection. We also observe that MLNDCs mostly traffic to the intestine where they enhance resistance by reduction in the mortality and in the number of brain cysts. Thus, ex vivo TAg-pulsed MLNDCs represent a powerful tool for the study of protective immunity to T. gondii, delivered through its natural route of entry. These findings might impact the design of vaccine strategies against other invasive microorganisms known to be delivered through digestive tract.


Figures

FIG. 1.
FIG. 1.
Surface phenotype analysis of sorted DC populations from SP and MLN. Sorted CD11c+ DCs from SP and MLN were analyzed for expression of various surface molecules. The results are shown as histograms with fluorescence intensity on the x axis and cell number on the y axis. The light gray lines represent staining of SPDCs, and the black lines represent staining of MLNDCs. Isotype-matched control is indicated for each antibody set with a solid peak. The data depicted here represent four independent experiments producing similar results.
FIG. 2.
FIG. 2.
Definition of DC subpopulations from spleen and MLNs. Dot plots show the CD8-versus-CD11c profile of SPDCs and MLNDCs. CD8+ and CD8 DC subpopulations can be defined (R1 and R2) in the spleen. In the MLNs an additional CD8int DC subset exists (R3). These data are representative of four experiments with similar results.
FIG. 3.
FIG. 3.
Cytokine production by MLNDCs and SPDCs after TAg stimulation. Fluorescence-activated cell sorting-purified CD11c+ DCs (106 per well) from CBA/J and C57BL/6 mice were incubated overnight in the presence of TAg (50 μg/ml). The overnight culture supernatants (5 ml) were concentrated to 1 ml through dialysis tubing and were tested for the presence of IL-12, IL-10, IFN-γ, and TGF-β by enzyme-linked immunosorbent assay. Each column is representative of three separate experiments. Results are expressed as the means ± standard errors of the means.
FIG. 4.
FIG. 4.
Survival of C57BL/6 mice following immunization with unpulsed MLNDCs, unpulsed SPDCs, TAg-pulsed MLNDCs and TAg-pulsed SPDCs. Mice immunized with 2.5 × 10⁵ unpulsed DCs or TAg-pulsed MLNDCs and untreated mice were orally infected with 10 cysts of T. gondii 5 days later. Mice were observed daily for mortality. One representative experiment of three is shown.
FIG. 5.
FIG. 5.
Assay for protection against oral challenge. CBA/J mice were immunized with 2.5 × 10⁵ unpulsed MLNDCs and TAg-pulsed MLNDCs (A) or with 2.5 × 10⁵ unpulsed SPDCs and TAg-pulsed SPDCs (C). (B) CBA/J mice were orally infected with 80 cysts. C57BL/6 mice were immunized with 2.5 × 10⁵ unpulsed MLNDCs or TAg-pulsed MLNDCs. (D) C57BL/6 mice were orally infected with 10 cysts of T. gondii 5 days later. A comparison of protection between CBA/J mice immunized with TAg-pulsed MLNDCs and TAg-pulsed SPDCs was performed. Cyst burden was enumerated by counting brain cysts at 30 days postchallenge in the CBA/J mice and in the C57BL/6 survivors + standard deviation (error bars). Results of one of three similar experiments are shown. *, P < 0.001.
FIG. 6.
FIG. 6.
Western blot analysis of TAg recognized by intestinal IgA antibodies and MAbs. Fresh fecal samples were collected 21 days after infection of CBA/J mice with T. gondii cysts (strain 76K) (lanes 1 and 2), 21 days after injection of CBA/J mice with unpulsed SPDCs (lane 3), with TAg-pulsed SPDCs (lanes 4 and 5), with unpulsed MLNDCs (lane 6), or with TAg-pulsed MLNDCs (lanes 7 and 8). The following MAbs were used: 3G11 (anti-p22 [SAG2]) (lane a), 1E5 (anti-p30 [SAG1]) (lane b), 1F12 (anti-p43 [SAG3]) (lane c), 4A7 (anti-55- and 60-kDa [ROP2 to ROP4]) (lane d), 1F7 (anti-gp60 [MIC1]) (lane e), 2F3 (anti-p80 [MIC3]) (lane f), and 4A11 (anti-p100 [MIC2]) (lane g). The molecular masses (kilodaltons) of protein standards are given on the right.
FIG. 7.
FIG. 7.
Cellular proliferative response and cytokine production following i.v. immunization with 2.5 × 10⁵ TAg-pulsed CBA/J MLNDCs after challenge with 80 cysts of T. gondii 76K. At 28 days spleen and MLN cells were isolated and stimulated in vitro with TAg (10 μg/ml). Proliferation was assessed after 4 days. Values for IL-2 and IL-4 were measured at 24 h, for IFN-γ at 72 h and for IL-10 and IL-5 at 96 h of culture. Results are mean cytokine concentrations or counts per minute for proliferation assays on spleen and MLN cells from three mice per experimental group. Results from one of three similar experiments are shown and are expressed as the mean ± standard error of the mean. Symbols: *, P < 0.001; #, P < 0.001.
FIG. 8.
FIG. 8.
Cellular proliferative response and cytokine production following i.v. immunization with 2.5 × 10⁵ TAg-pulsed C57BL/6 MLNDCs after challenge with 10 cysts of T. gondii 76K. At 28 days spleen and MLN cells were isolated and stimulated in vitro with TAg (10 μg/ml). Proliferation was assessed after 4 days. Values for IL-2 and IL-4 were measured at 24 h, those for IFN-γ were measured at 72 h, and those for IL-10 and IL-5 were measured at 96 h of culture. Results are mean cytokine concentrations or counts per minute for proliferation assays on spleen and MLN cells from three mice per experimental group. Results from one of three similar experiments are shown and are expressed as the mean ± standard error of the mean. Symbols: *, P < 0.001; #, P < 0,001.
FIG. 9.
FIG. 9.
Cellular proliferative response and cytokine production following i.v. immunization with 2.5 × 10⁵ TAg-pulsed CBA/J SPDCs after challenge with 80 cysts of T. gondii 76K. At 28 days spleen and MLN cells were isolated and stimulated in vitro with TAg (10 μg/ml). Proliferation was assessed after 4 days. Values for IL-2 and IL-4 were measured at 24 h, for IFN-γ at 72 h and for IL-10 and IL-5 at 96 h of culture. Results are mean cytokine concentrations or counts per minute for proliferation assays on spleen and MLN cells from three mice per experimental group. Results from one of three similar experiments are shown and are expressed as the mean ± standard error of the mean. Symbols: *, P < 0.001; #, P < 0.001.
FIG. 10.
FIG. 10.
Unpulsed or TAg-pulsed SPDCs and unpulsed or TAg-pulsed MLNDCs were isolated from the same CBA/J mice. DCs were incubated with 51Cr. DCs (5 × 10⁵) were injected and 2 h after the transfer, radioactivity was measured in each organ. Homing to different organs was compared between SPDCs and MLNDCs. Results are expressed as the percentage of radioactivity recovered from the specific organ compared with the total radioactivity in the mouse. Results from one of the three similar experiments are shown and are expressed as the mean ± standard error of the mean. *, P < 0.05. Abbreviations: PP, Peyer's patches; ILN, iliac lymph nodes; BLN, brachial lymph nodes; MedLN, mediastinal lymph nodes.

Similar articles

Cited by

References

    1. Anjuere, F., P. Martin, I. Ferrero, M. L. Fraga, G. M. del Hoyo, N. Wright, and C. Ardavin. 1999. Definition of dendritic cell subpopulations present in the spleen, Peyer's patches, lymph nodes, and skin of the mouse. Blood 93:590-598. - PubMed
    1. Bourguin, I., M. Moser, D. Buzoni-Gatel, F. Tielemans, D. Bout, J. Urbain, and O. Leo. 1998. Murine dendritic cells pulsed in vitro with Toxoplasma gondii antigens induce protective immunity in vivo. Infect. Immun. 66:4867-4874. - PMC - PubMed
    1. Buzoni-Gatel, D., A. C. Lepage, I. H. Dimier-Poisson, D. T. Bout, and L. H. Kasper. 1997. Adoptive transfer of gut intraepithelial lymphocytes protects against murine infection with Toxoplasma gondii. J. Immunol. 158:5883-5889. - PubMed
    1. Casciotti, L. K., H. Ely, M. E. Williams, and I. A. Khan. 2002. CD8+-T-cell immunity against Toxoplasma gondii can be induced but not maintained in mice lacking conventional CD4+ T cells. Infect. Immun. 70:434-443. - PMC - PubMed
    1. Chang, C.-C., A. Wright, and J. Punnonen. 2000. Monocyte-derived CD1a+ and CD1a- dendritic cell subsets differ in their cytokine production profiles, susceptibilities to transfection, and capacities to direct Th cell differentiation. J. Immunol. 165:3584-3591. - PubMed

MeSH terms

LinkOut - more resources