A family of acr-coregulated Mycobacterium tuberculosis genes shares a common DNA motif and requires Rv3133c (dosR or devR) for expression
- PMID: 12933881
- PMCID: PMC187371
- DOI: 10.1128/IAI.71.9.5332-5343.2003
A family of acr-coregulated Mycobacterium tuberculosis genes shares a common DNA motif and requires Rv3133c (dosR or devR) for expression
Abstract
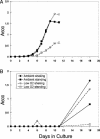
Previous work has shown that the divergently transcribed Mycobacterium tuberculosis genes acr (hspX, Rv2031c) and acg (Rv2032) are induced under conditions of shallow standing culture and low oxygen and intracellularly within macrophages. We used a combination of computational and experimental methods to identify promoters for eight additional genes that are regulated in a similar manner and that comprise an acr-coregulated promoter (ACP) family. Transcriptional regulation of these ACP family members was evaluated by using a plasmid-based promoter-green fluorescent protein fusion system and flow cytometry. All promoters showed increased expression in shallow standing versus shaking cultures, in low- versus high-oxygen conditions, and intracellularly within macrophages versus extracellularly in tissue culture medium. However, there were quantitative differences in expression among promoters and among conditions for each promoter. A conserved 18-bp palindromic sequence motif was identified in all ACPs by Gibbs sampling-based computational analyses. Two such motifs overlap regions in the acr and acg promoters that were previously shown to be required for their expression. In addition, we found that 5% carbon dioxide was required for growth of Mycobacterium bovis BCG under microaerophilic (1.3% O(2)) culture conditions and fully prevented the growth cessation typically associated with rapid removal of oxygen. These findings are likely to be relevant to the in vivo environment and will contribute to our understanding of the pathogenesis of tuberculosis infection.
Figures


Similar articles
-
Expression of the Mycobacterium tuberculosis acr-coregulated genes from the DevR (DosR) regulon is controlled by multiple levels of regulation.Infect Immun. 2008 Jun;76(6):2478-89. doi: 10.1128/IAI.01443-07. Epub 2008 Apr 7. Infect Immun. 2008. PMID: 18391009 Free PMC article.
-
Identification of a Mycobacterium tuberculosis putative classical nitroreductase gene whose expression is coregulated with that of the acr aene within macrophages, in standing versus shaking cultures, and under low oxygen conditions.Infect Immun. 2002 Mar;70(3):1518-29. doi: 10.1128/IAI.70.3.1518-1529.2002. Infect Immun. 2002. PMID: 11854240 Free PMC article.
-
Identification and characterization of mycobacterial proteins differentially expressed under standing and shaking culture conditions, including Rv2623 from a novel class of putative ATP-binding proteins.Infect Immun. 2001 Sep;69(9):5777-85. doi: 10.1128/IAI.69.9.5777-5785.2001. Infect Immun. 2001. PMID: 11500455 Free PMC article.
-
Characterization of a cAMP responsive transcription factor, Cmr (Rv1675c), in TB complex mycobacteria reveals overlap with the DosR (DevR) dormancy regulon.Nucleic Acids Res. 2016 Jan 8;44(1):134-51. doi: 10.1093/nar/gkv889. Epub 2015 Sep 10. Nucleic Acids Res. 2016. PMID: 26358810 Free PMC article.
-
[Efficacy and safety of vaccines against tuberculosis in the relation to genetic variability of Mycobacterium bovis BCG strains].Przegl Epidemiol. 2011;65(4):621-8. Przegl Epidemiol. 2011. PMID: 22390050 Review. Polish.
Cited by
-
Induction of a novel class of diacylglycerol acyltransferases and triacylglycerol accumulation in Mycobacterium tuberculosis as it goes into a dormancy-like state in culture.J Bacteriol. 2004 Aug;186(15):5017-30. doi: 10.1128/JB.186.15.5017-5030.2004. J Bacteriol. 2004. PMID: 15262939 Free PMC article.
-
Comparative genomics of the dormancy regulons in mycobacteria.J Bacteriol. 2011 Jul;193(14):3446-52. doi: 10.1128/JB.00179-11. Epub 2011 May 20. J Bacteriol. 2011. PMID: 21602344 Free PMC article.
-
The enduring hypoxic response of Mycobacterium tuberculosis.PLoS One. 2008 Jan 30;3(1):e1502. doi: 10.1371/journal.pone.0001502. PLoS One. 2008. PMID: 18231589 Free PMC article.
-
Comparative analysis of Mycobacterium and related Actinomycetes yields insight into the evolution of Mycobacterium tuberculosis pathogenesis.BMC Genomics. 2012 Mar 28;13:120. doi: 10.1186/1471-2164-13-120. BMC Genomics. 2012. PMID: 22452820 Free PMC article.
-
Multiple small RNAs identified in Mycobacterium bovis BCG are also expressed in Mycobacterium tuberculosis and Mycobacterium smegmatis.Nucleic Acids Res. 2010 Jul;38(12):4067-78. doi: 10.1093/nar/gkq101. Epub 2010 Feb 24. Nucleic Acids Res. 2010. PMID: 20181675 Free PMC article.
References
-
- Bermudez, L. E., F. J. Sangari, P. Kolonoski, M. Petrofsky, and J. Goodman. 2002. The efficiency of the translocation of Mycobacterium tuberculosis across a bilayer of epithelial and endothelial cells as a model of the alveolar wall is a consequence of transport within mononuclear phagocytes and invasion of alveolar epithelial cells. Infect. Immun. 70:140-146. - PMC - PubMed
-
- Burtis, C., and E. Ashwood (ed.). 1994. Tietz textbook of clinical chemistry, 2nd ed. W. B. Saunders Company, Philadelphia, Pa.
-
- Cole, S. T., R. Brosch, J. Parkhill, T. Garnier, C. Churcher, D. Harris, S. V. Gordon, K. Eiglmeier, S. Gas, C. E. Barry III, F. Tekaia, K. Badcock, D. Basham, D. Brown, T. Chillingworth, R. Connor, R. Davies, K. Devlin, T. Feltwell, S. Gentles, N. Hamlin, S. Holroyd, T. Hornsby, K. Jagels, B. G. Barrell, et al. 1998. Deciphering the biology of Mycobacterium tuberculosis from the complete genome sequence. Nature 393:537-544. - PubMed
Publication types
MeSH terms
Substances
Grants and funding
LinkOut - more resources
Full Text Sources
Other Literature Sources
Molecular Biology Databases

