. 2003 Sep 2;100(18):10370-5.
doi: 10.1073/pnas.1832361100. Epub 2003 Aug 21.

Expression deconvolution: a reinterpretation of DNA microarray data reveals dynamic changes in cell populations

Affiliations

Expression deconvolution: a reinterpretation of DNA microarray data reveals dynamic changes in cell populations

Peng Lu et al. Proc Natl Acad Sci U S A. .

Abstract

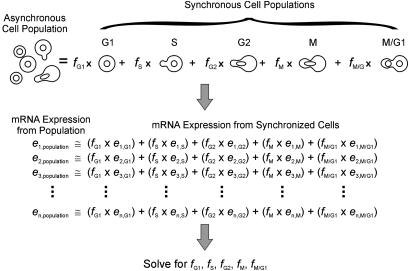
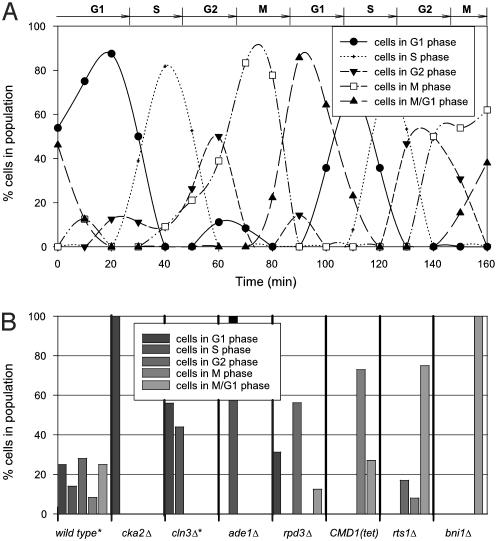
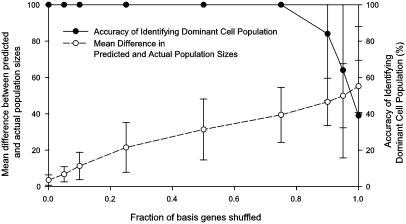
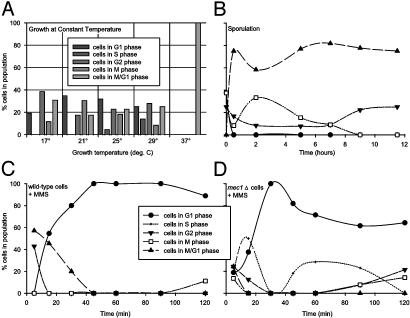
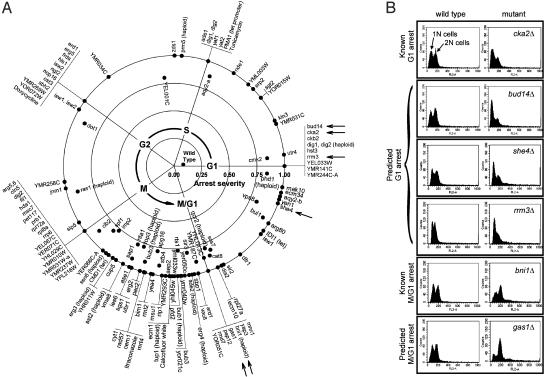
Cells grow in dynamically evolving populations, yet this aspect of experiments often goes unmeasured. A method is proposed for measuring the population dynamics of cells on the basis of their mRNA expression patterns. The population's expression pattern is modeled as the linear combination of mRNA expression from pure samples of cells, allowing reconstruction of the relative proportions of pure cell types in the population. Application of the method, termed expression deconvolution, to yeast grown under varying conditions reveals the population dynamics of the cells during the cell cycle, during the arrest of cells induced by DNA damage and the release of arrest in a cell cycle checkpoint mutant, during sporulation, and following environmental stress. Using expression deconvolution, cell cycle defects are detected and temporally ordered in 146 yeast deletion mutants; six of these defects are independently experimentally validated. Expression deconvolution allows a reinterpretation of the cell cycle dynamics underlying all previous microarray experiments and can be more generally applied to study most forms of cell population dynamics.


Figures

Fig. 1.
Fig. 1.
In the method of expression deconvolution, mRNA expression data from a mixed cell population are modeled as the weighted average of expression data from a set of basis experiments, where the weights describe the proportions of each basis cell type in the overall population. As illustrated, expression data from asynchronously grown yeast cells (left data set) are fitas the weighted linear combination of expression data from synchronized cells from specific times in the cell cycle (five right data sets), representing expression characteristic of “pure” populations of cells in each cell cycle phase. A system of linear equations is established, with one equation per gene, and solved for the optimal proportions of cells that best model the expression profile of the cell population.
Fig. 2.
Fig. 2.
Validating expression deconvolution on cells with known population dynamics. (A) Results of deconvoluting mRNA expression of a synchronized cell population. The proportion of cells in each cell cycle phase, measured by expression deconvolution of microarray data (6) and plotted as a function of time, match well with the phases observed by microscopy and FACS analysis (6) marked at the top of the figure. Points are fit with spline curves for ease of interpretation. (B) Application of expression deconvolution to asynchronously grown yeast deletion mutants known to produce full or partial cell cycle arrest phenotypes. Each bar graph shows percentages of cells in different cell cycle phases as estimated by expression deconvolution. Wild-type cells show roughly equal proportions of cells in different phases, but mutant strains show skewed cell populations, suggesting cell cycle delay phenotypes. The mRNA expression data in B are from ref. , except those marked with asterisks, which are from ref. .
Fig. 3.
Fig. 3.
Comparing the quantitative and qualitative performance of the algorithm on synthetic data. One hundred cell populations were randomly generated by mixing basis experiments such that >50% of the population derives from one basis experiment. During expression deconvolution, noise was added to the basis experiments used for deconvolution by shuffling, for a given gene, the expression measurements across the basis experiments, simulating the presence of competing transcriptional programs besides the cell cycle. As the fraction of shuffled basis genes increases up to ≈85%, deconvolution correctly identifies the dominant cell population (filled circles), although the error in the numerical estimate of the population's size increases steadily (open circles). Error bar indicates ±1 SD from the mean of the 100 trials.
Fig. 4.
Fig. 4.
Application of expression deconvolution to yeast grown under varying conditions reveals complex cell population dynamics. Each graph plots the reconstructed distribution of cells in different cell cycle phases. (A) Yeast grown (10) at 17-29°C appear asynchronous, whereas those grown at 37°C delay strongly in M/G1 phase. (B) Yeast induced to sporulate (9) quickly synchronize with a cell state whose global mRNA expression pattern resembles M/G1 phase cells. (C and D) Cells challenged with the DNA damaging agent MMS (11) quickly arrest in G1 phase. Wild-type cells (C) remain arrested, even after 2 h, whereas mec1Δ checkpoint mutant cells (D) progress through the arrest within 40 min. In B-D, points are fit with spline curves for ease of interpretation. All curves follow the legend displayed in C.
Fig. 5.
Fig. 5.
(A) One hundred forty-six yeast genes whose deletion confers severe cell cycle delays are plotted, ordered by time of observed cell cycle defect. The timing of each defect, calculated as the center of mass of the deconvoluted cell population, is indicated by the angular position around the circle, with G1 phase defects at the x axis and with time increasing in a counterclockwise manner. Radial distance from the plot origin indicates defect severity. Asynchronous wild-type cells are therefore plotted near the origin, whereas strong G1 arrest mutants are at the right-hand boundary. The complete table of deconvolution phenotypes for all 300 strains (12), sorted by defect severity or timing, is available as Table 2, which is published as supporting information on the PNAS web site. Arrows indicate mutants whose defects are independently validated in B. Each horizontal panel in B shows the measured DNA content of two Mat a haploid yeast strains, derived from a single tetrad of a heterozygous diploid yeast strain deleted in the gene labeled at right. Asynchronously grown wild-type cells (Left) show roughly equal proportions of 1N and 2N DNA content, measured by using FACS analysis, whereas deletion mutant strains (Right) show skewed distributions characteristic of the predicted G1 (top four panels) or M/G1 (bottom two panels) delay phenotypes.

Similar articles

Cited by

References

    1. Stern, C. D. & Fraser, S. E. (2001) Nat. Cell Biol. 3, E216-E218. - PubMed
    1. Herzenberg, L. A., De Rosa, S. C. & Herzenberg, L. A. (2000) Immunol. Today 21, 383-390. - PubMed
    1. Alberts, B., Bray, D., Lewis, J., Raff, M., Roberts, K. & Watson, J. D. (1994) Molecular Biology of the Cell (Garland, New York), 3rd Ed.
    1. Su, A. I., Cooke, M. P., Ching, K. A., Hakak, Y., Walker, J. R., Wiltshire, T., Orth, A. P., Vega, R. G., Sapinoso, L. M., Moqrich, A., et al. (2002) Proc. Natl. Acad. Sci. USA 99, 4465-4470. - PMC - PubMed
    1. Spellman, P. T., Sherlock, G., Zhang, M. Q., Iyer, V. R., Anders, K., Eisen, M. B., Brown, P. O., Botstein, D. & Futcher, B. (1998) Mol. Biol. Cell 9, 3273-3297. - PMC - PubMed

Publication types

MeSH terms

LinkOut - more resources