

Signature gene expression profiles discriminate between isoniazid-, thiolactomycin-, and triclosan-treated Mycobacterium tuberculosis
- PMID: 12936993
- PMCID: PMC182614
- DOI: 10.1128/AAC.47.9.2903-2913.2003
Signature gene expression profiles discriminate between isoniazid-, thiolactomycin-, and triclosan-treated Mycobacterium tuberculosis
Abstract
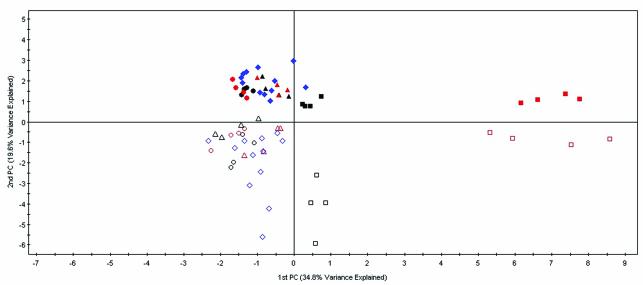
Genomic technologies have the potential to greatly increase the efficiency of the drug development process. As part of our tuberculosis drug discovery program, we used DNA microarray technology to profile drug-induced effects in Mycobacterium tuberculosis. Expression profiles of M. tuberculosis treated with compounds that inhibit key metabolic pathways are required as references for the assessment of novel antimycobacterial agents. We have studied the response of M. tuberculosis to treatment with the mycolic acid biosynthesis inhibitors isoniazid, thiolactomycin, and triclosan. Thiolactomycin targets the beta-ketoacyl-acyl carrier protein (ACP) synthases KasA and KasB, while triclosan inhibits the enoyl-ACP reductase InhA. However, controversy surrounds the precise mode of action of isoniazid, with both InhA and KasA having been proposed as the primary target. We have shown that although the global response profiles of isoniazid and thiolactomycin are more closely related to each other than to that of triclosan, there are differences that distinguish the mode of action of these two drugs. In addition, we have identified two groups of genes, possibly forming efflux and detoxification systems, through which M. tuberculosis may limit the effects of triclosan. We have developed a mathematical model, based on the expression of 21 genes, which is able to perfectly discriminate between isoniazid-, thiolactomycin-, or triclosan-treated M. tuberculosis. This model is likely to prove invaluable as a tool to improve the efficiency of our drug development programs by providing a means to rapidly confirm the mode of action of thiolactomycin analogues or novel InhA inhibitors as well as helping to translate enzyme activity into whole-cell activity.
Figures
References
-
- Alland, D., I. Kramnik, T. R. Weisbrod, L. Otsubo, R. Cerny, L. P. J. W. Miller, and B. R. Bloom. 1998. Identification of differentially expressed mRNA in prokaryotic organisms by customized amplification libraries (DECAL)—the effect of isoniazid on gene expression in Mycobacterium tuberculosis. Proc. Natl. Acad. Sci. USA 95:13227-13232. - PMC - PubMed
-
- Banerjee, A., E. Dubnau, A. Quemard, A. S. Balasubramanian, K. S. Um, T. Wilson, D. Collins, G. W. de Lisle, and W. R. Jacobs. 1994. inhA, a gene encoding a target for isoniazid and ethionamide in Mycobacterium tuberculosis. Science 263:227-230. - PubMed
-
- Barry, C. E., M. Wilson, R. Lee, and G. K. Schoolnik. 2000. DNA microarrays and combinatorial chemical libraries: tools for the drug discovery pipeline. Int. J. Tuberc. Lung Dis. 4:S189-S193. - PubMed
-
- Betts, J. C. 2002. Transcriptomics and proteomics: tools for the identification of novel drug targets and vaccine candidates for tuberculosis. IUBMB Life 53:239-242. - PubMed
MeSH terms
Substances
LinkOut - more resources
Full Text Sources
Medical
Molecular Biology Databases
Research Materials
