. 2003 Nov;126(Pt 11):2476-96.
doi: 10.1093/brain/awg245. Epub 2003 Aug 22.

Neural correlates of motor recovery after stroke: a longitudinal fMRI study

Affiliations

Neural correlates of motor recovery after stroke: a longitudinal fMRI study

N S Ward et al. Brain. 2003 Nov.

Abstract

Recovery of motor function after stroke may occur over weeks or months and is often attributed to cerebral reorganization. We have investigated the longitudinal relationship between recovery after stroke and task-related brain activation during a motor task as measured using functional MRI (fMRI). Eight first-ever stroke patients presenting with hemiparesis resulting from cerebral infarction sparing the primary motor cortex, and four control subjects were recruited. Subjects were scanned on a number of occasions whilst performing an isometric dynamic visually paced hand grip task. Recovery in the patient group was assessed using a battery of outcome measures at each time point. Task-related brain activations decreased over sessions as a function of recovery in a number of primary and non-primary motor regions in all patients, but no session effects were seen in the controls. Furthermore, consistent decreases across sessions correlating with recovery were seen across the whole patient group independent of rate of recovery or initial severity, in primary motor cortex, premotor and prefrontal cortex, supplementary motor areas, cingulate sulcus, temporal lobe, striate cortex, cerebellum, thalamus and basal ganglia. Although recovery-related increases were seen in different brain regions in four patients, there were no consistent effects across the group. These results further our understanding of the recovery process by demonstrating for the first time a clear temporal relationship between recovery and task-related activation of the motor system after stroke.


Figures

Fig. 1
Fig. 1
Axial structural T1-weighted MRI scans at the level of maximum infarct volume for each patient.
Fig. 2
Fig. 2
Plots of normalized overall recovery scores for each patient across sessions. Each patient had nine separate performance scores recorded at each fMRI session (Rankin, Barthel, OPSS, etc.), creating nine recovery curves per patient. The overall recovery score represents the first principal component of a principal component analysis of these nine recovery curves. The amount of variance in the original data set explained by the first principal component is given in parentheses. There is no scale on the y-axis because the scores are normalized, and have no meaningful absolute value, only relative value, within subject.
Fig. 3
Fig. 3
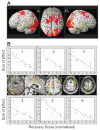
Results of single subject (patient 7) longitudinal analysis examining for linear changes in task-related brain activations over sessions as a function of recovery. Patient 7 suffered from a left-sided pontine infarct resulting in right hemiparesis. (A) Results are surface rendered onto a canonical brain; red areas represent recovery-related decreases in task-related activation across sessions, and green areas represent the equivalent recovery-related increases. All voxels are significant at P < 0.001 (uncorrected for multiple comparisons) for display purposes. The brain is shown (from left to right) from the left (ipsilesional, IL) side, from above (left hemisphere on the left), and from the right (contralesional, CL). (B) Results are displayed on patient’s own normalized T1-weighted anatomical images (voxels significant at P < 0.05, corrected for multiple comparisons across the whole brain), with corresponding plots of size of effect against overall recovery score (normalized), for selected brain regions. Coordinates of peak voxel in each region are followed by the correlation coefficient and the associated P value: (1) ipsilesional cerebellum (x = −26, y = −84, z = −22) (r2 = 0.77, P < 0.01), (2) contralesional dorsolateral premotor cortex (x = 38, y = 0, z = 58) (r2 = 0.85, P < 0.01), (3) contralesional M1 (x = 28, y = −14, z = 70) (r2 = 0.74, P < 0.01), (4) ipsilesional SMA (x = −2, y = −2, z = 60) (r2 = 0.53, P = 0.02), (5) ipsilesional M1 (x = −30, y = −14, z = 58) (r2 = 0.80, P < 0.01), (6) contralesional dorsolateral premotor cortex (x = −18, y = −10, z = 74) (r2 = 0.63, P = 0.01).
Fig. 4
Fig. 4
Group ‘recovery map’: brain regions in which linear reductions in task-related activation across sessions as a function of recovery were consistently detected for the whole group. This represents the random effects group analysis, in which the data representing the individual ‘recovery maps’ were pooled across all subjects. Images for patients with left-sided lesions were flipped about the mid-sagittal line, so that all patients were assumed to have a lesion on the right side, with initial left hand weakness. Results are surface rendered onto a canonical brain. The brain is shown (from left to right) from the left (contralesional, CL) side, from above (left hemisphere on the left), and from the right (ipsilesional, IL). All clusters are significant at P < 0.05, corrected for multiple comparisons across whole brain.

References

    1. Andersson JL, Hutton C, Ashburner J, Turner R, Friston K. Modeling geometric deformations in EPI time series. Neuroimage. 2001;13:903–19. - PubMed
    1. Binkofski F, Fink GR, Geyer S, Buccino G, Gruber O, Shah NJ, et al. Neural activity in human primary motor cortex areas 4a and 4p is modulated differentially by attention to action. J Neurophysiol. 2002;88:514–9. - PubMed
    1. Blakemore SJ, Frith CD, Wolpert DM. The cerebellum is involved in predicting the sensory consequences of action. Neuroreport. 2001;12:1879–84. - PubMed
    1. Brett M, Leff AP, Rorden C, Ashburner J. Spatial normalization of brain images with focal lesions using cost function masking. Neuroimage. 2001;14:486–500. - PubMed
    1. Buchkremer-Ratzmann I, August M, Hagemann G, Witte OW. Electrophysiological transcortical diaschisis after cortical photothrombosis in rat brain. Stroke. 1996;27:1105–9. - PubMed

Publication types

MeSH terms