

Detection of oncofetal h19 RNA in rheumatoid arthritis synovial tissue
- PMID: 12937131
- PMCID: PMC1868271
- DOI: 10.1016/S0002-9440(10)63450-5
Detection of oncofetal h19 RNA in rheumatoid arthritis synovial tissue
Erratum in
- Am J Pathol. 2003 Dec;163(6):2645
Abstract
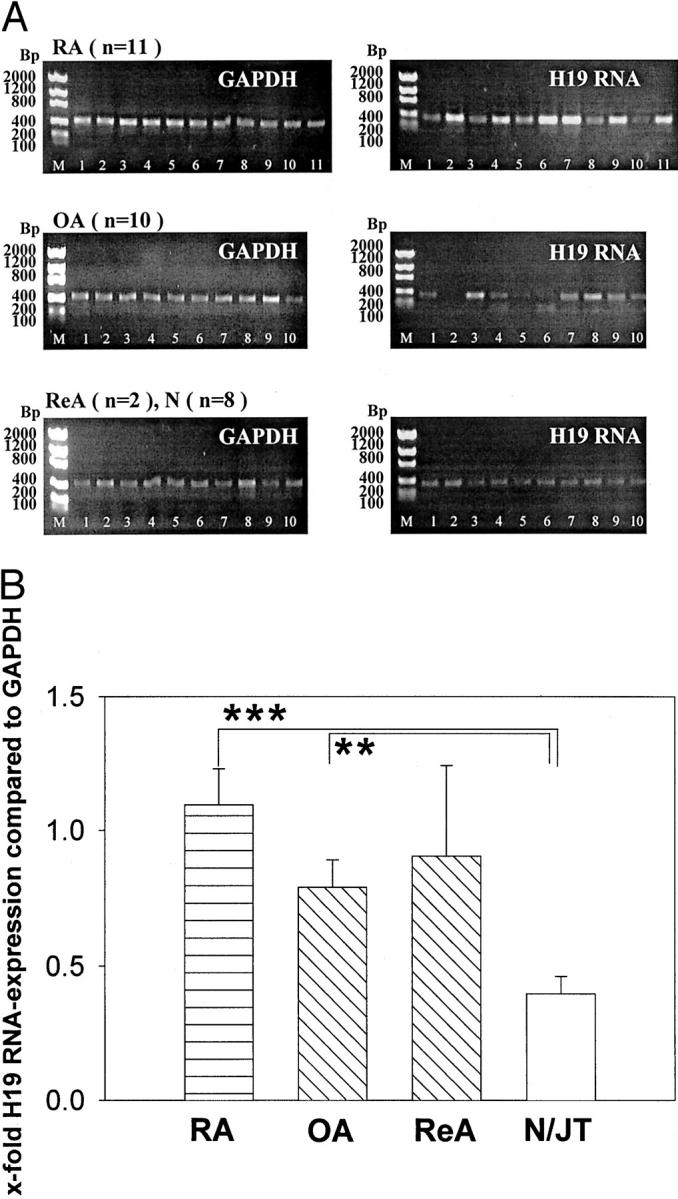
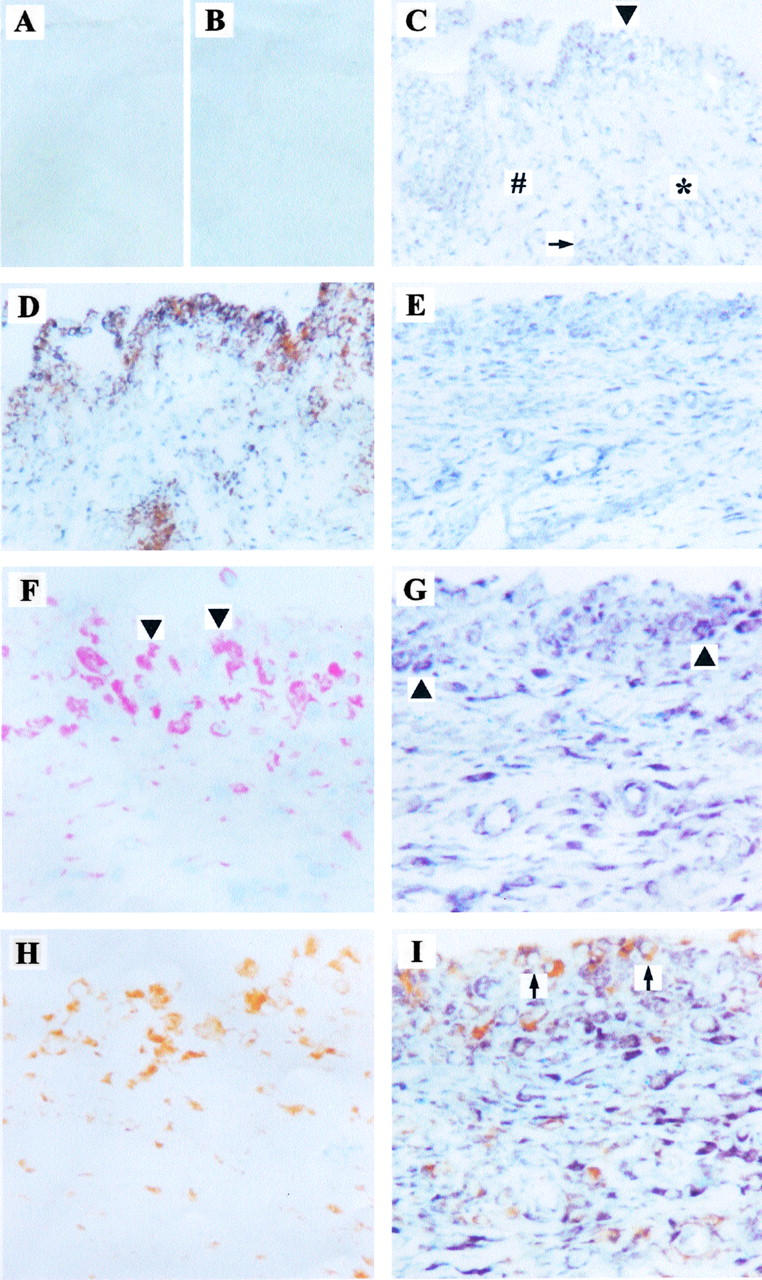
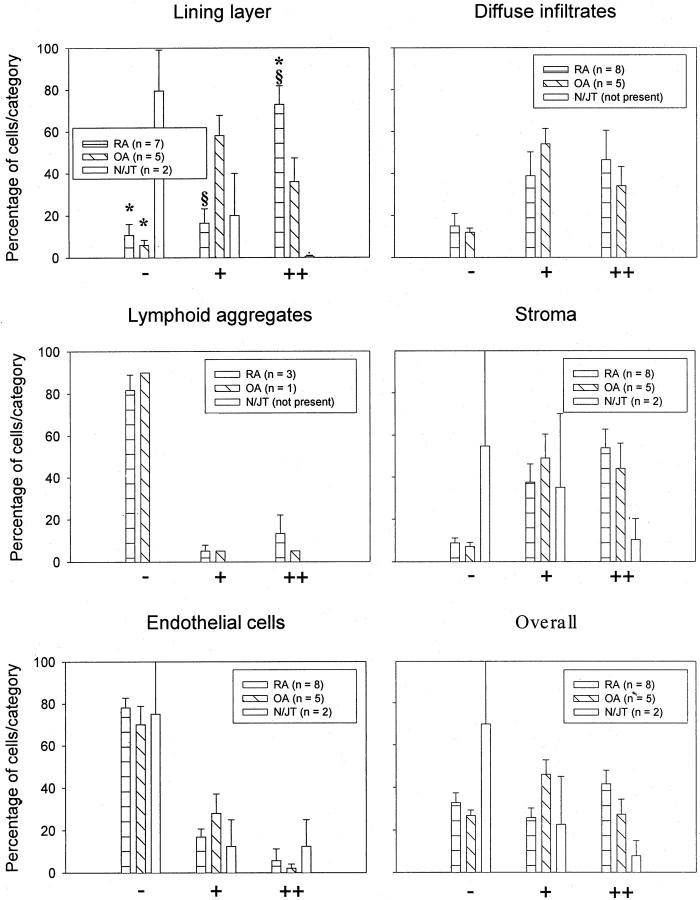
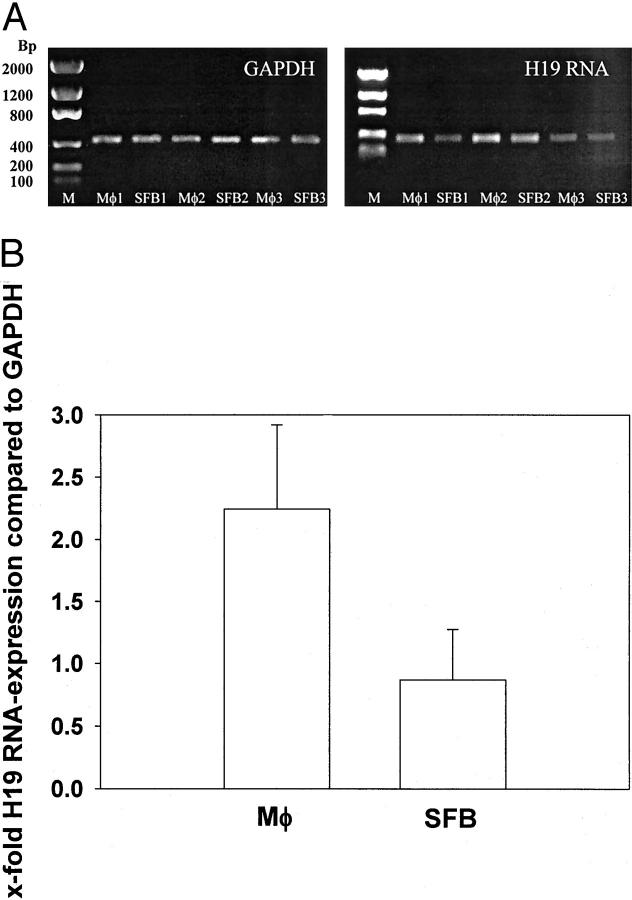
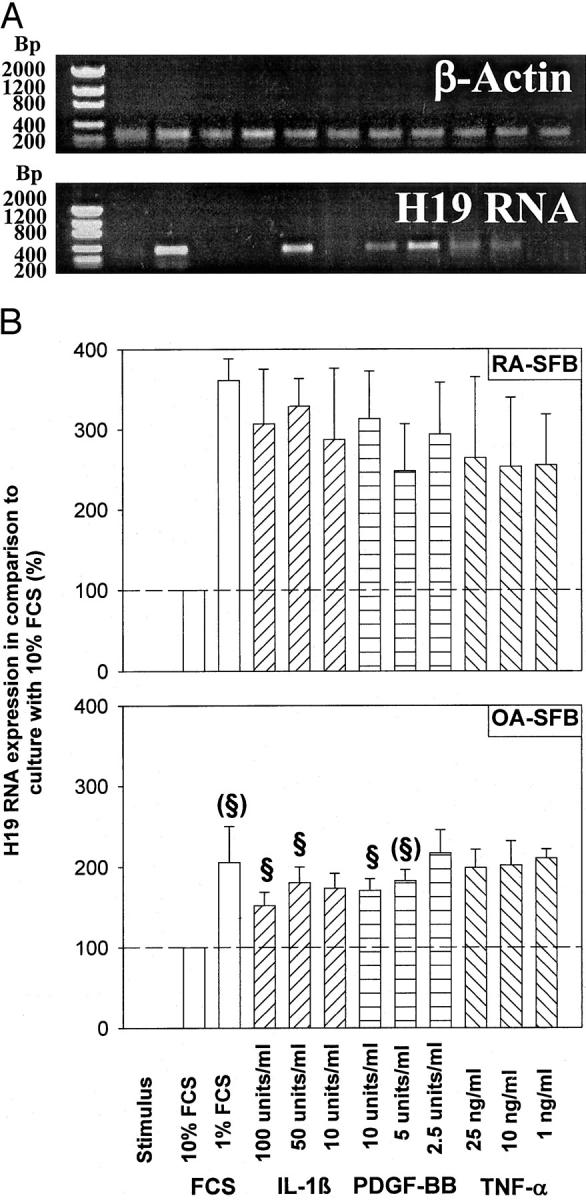
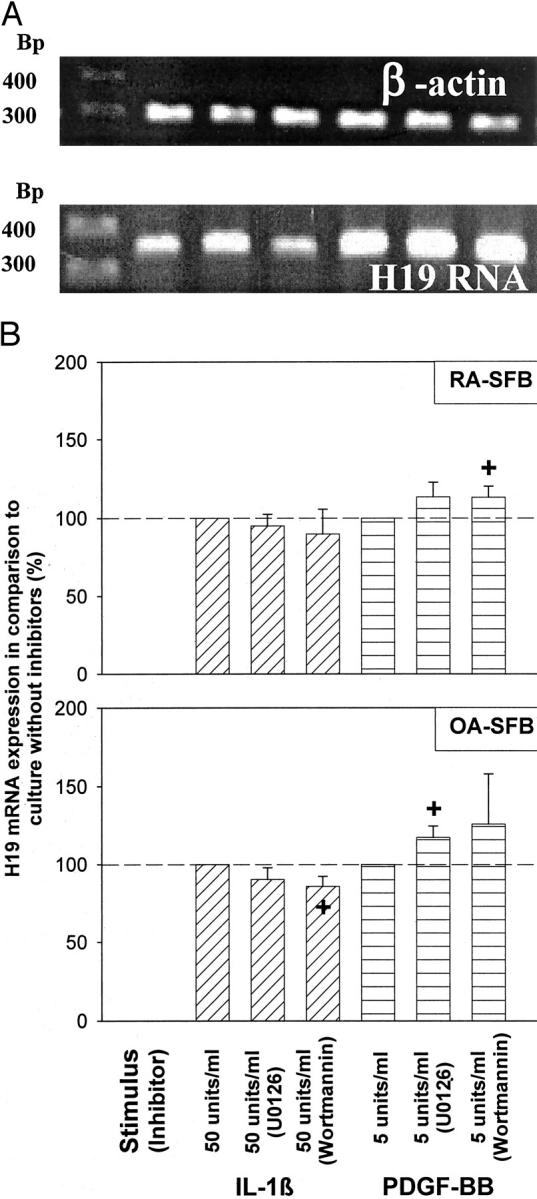
The expression of oncofetal H19 RNA and its localization/cellular source was analyzed in synovial tissue (ST) and isolated synovial macrophages (Mphi) or synovial fibroblasts (SFBs) by reverse transcriptase-polymerase chain reaction (RT-PCR), in situ hybridization, and immunohistochemistry. RT-PCR showed significantly higher H19 expression in ST from patients with rheumatoid arthritis (RA) (P = 0.000) and osteoarthritis (OA) (P = 0.009) than in normal/joint trauma controls (N/JT), but comparable levels in reactive arthritis. In situ hybridization demonstrated strong signals in all RA-ST samples (n = 8), with > or =85% positive cells in the lining layer, diffuse infiltrates, and stroma regions. In lymphoid aggregates and endothelial cells only 20% were positive. RA-ST contained a significantly higher percentage of strongly positive lining cells than OA-ST and N/JT-ST. H19 RNA was expressed in both Mphi and SFBs, as confirmed by RT-PCR in isolated RA Mphi and SFBs (n = 3). In RA-SFBs, low constitutive H19 RNA expression in culture (10% fetal calf serum) was strongly increased on starvation (3.5-fold, 1% fetal calf serum), with or without the addition of interleukin-1beta (10 to 100 U/ml), tumor necrosis factor-alpha (1 to 25 ng/ml), or platelet-derived growth factor-BB (2.5 to 10 U/ml). In OA-SFBs, this starvation-induced increase was lower (twofold), reaching significant differences compared with RA-SFBs after stimulation with interleukin-1beta and platelet-derived growth factor-BB. In both RA- and OA-SFBs, the MAP-kinase ERK-1/2 pathway and the phosphatidylinositol-3 kinase pathway influenced H19 RNA expression, as shown by inhibitor studies. Significant overexpression of H19 RNA and its increased sensitivity to starvation/cytokine regulation in RA suggests a pathogenetic role of this oncofetal gene, possibly reflecting embryonal dedifferentiation of the adult ST and/or ongoing inflammatory/oxidative stress.
Figures
Similar articles
-
Comparison of cathepsins K and S expression within the rheumatoid and osteoarthritic synovium.Arthritis Rheum. 2002 Mar;46(3):663-74. doi: 10.1002/art.10114. Arthritis Rheum. 2002. PMID: 11920402
-
Expression of platelet-derived growth factors C and D in the synovial membrane of patients with rheumatoid arthritis and osteoarthritis.Arthritis Rheum. 2006 Mar;54(3):788-94. doi: 10.1002/art.21670. Arthritis Rheum. 2006. PMID: 16508943
-
Responses to the proinflammatory cytokines interleukin-1 and tumor necrosis factor alpha in cells derived from rheumatoid synovium and other joint tissues involve nuclear factor kappaB-mediated induction of the Ets transcription factor ESE-1.Arthritis Rheum. 2003 May;48(5):1249-60. doi: 10.1002/art.10942. Arthritis Rheum. 2003. PMID: 12746898
-
Platelet-derived growth factors and heparin-binding (fibroblast) growth factors in the synovial tissue pathology of rheumatoid arthritis.Semin Arthritis Rheum. 1991 Dec;21(3):191-9. doi: 10.1016/0049-0172(91)90009-o. Semin Arthritis Rheum. 1991. PMID: 1724096 Review.
-
Activated synovial macrophages as targets for osteoarthritis drug therapy.Curr Drug Targets. 2010 May;11(5):576-85. doi: 10.2174/138945010791011965. Curr Drug Targets. 2010. PMID: 20199392 Review.
Cited by
-
Deciphering the Role of LncRNAs in Osteoarthritis: Inflammatory Pathways Unveiled.J Inflamm Res. 2024 Sep 20;17:6563-6581. doi: 10.2147/JIR.S489682. eCollection 2024. J Inflamm Res. 2024. PMID: 39318993 Free PMC article. Review.
-
Association of large intergenic noncoding RNA expression with disease activity and organ damage in systemic lupus erythematosus.Arthritis Res Ther. 2015 May 21;17(1):131. doi: 10.1186/s13075-015-0632-3. Arthritis Res Ther. 2015. PMID: 25994030 Free PMC article.
-
The expression of GAS5, THRIL, and RMRP lncRNAs is increased in T cells of patients with rheumatoid arthritis.Clin Rheumatol. 2019 Nov;38(11):3073-3080. doi: 10.1007/s10067-019-04694-z. Epub 2019 Jul 25. Clin Rheumatol. 2019. PMID: 31346885
-
Mechanisms of Antisense Transcription Initiation with Implications in Gene Expression, Genomic Integrity and Disease Pathogenesis.Noncoding RNA. 2019 Jan 21;5(1):11. doi: 10.3390/ncrna5010011. Noncoding RNA. 2019. PMID: 30669611 Free PMC article. Review.
-
Environmental Health and Long Non-coding RNAs.Curr Environ Health Rep. 2016 Sep;3(3):178-87. doi: 10.1007/s40572-016-0092-1. Curr Environ Health Rep. 2016. PMID: 27234044 Free PMC article. Review.
References
-
- Gay S: Rheumatoid arthritis. Curr Opin Rheumatol 2001, 13:191-192 - PubMed
-
- Yamanishi Y, Firestein GS: Pathogenesis of rheumatoid arthritis: the role of synoviocytes. Rheum Dis Clin North Am 2001, 27:355-371 - PubMed
-
- Tak PP, Zvaifler NJ, Green DR, Firestein GS: Rheumatoid arthritis and p53: how oxidative stress might alter the course of inflammatory diseases. Immunol Today 2000, 21:78-82 - PubMed
Publication types
MeSH terms
Substances
LinkOut - more resources
Full Text Sources
Other Literature Sources
Medical
Miscellaneous
