

Nuclear envelope irregularity is induced by RET/PTC during interphase
- PMID: 12937150
- PMCID: PMC1868259
- DOI: 10.1016/S0002-9440(10)63468-2
Nuclear envelope irregularity is induced by RET/PTC during interphase
Abstract
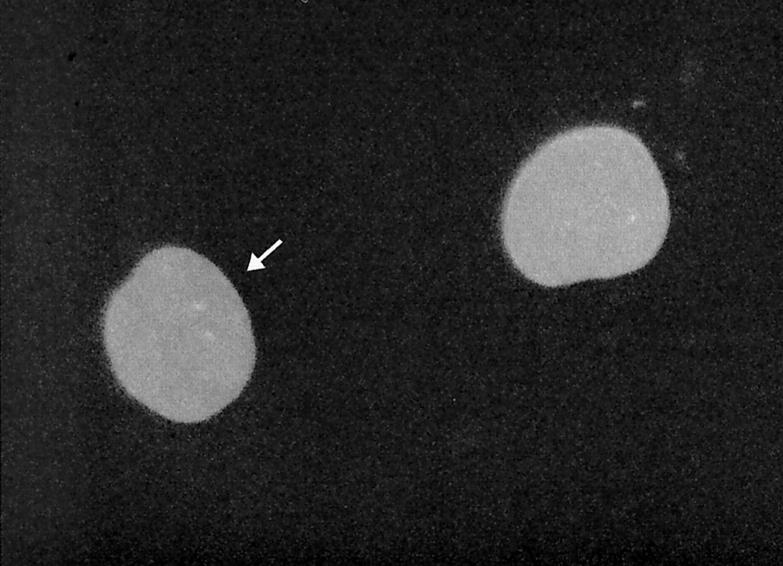
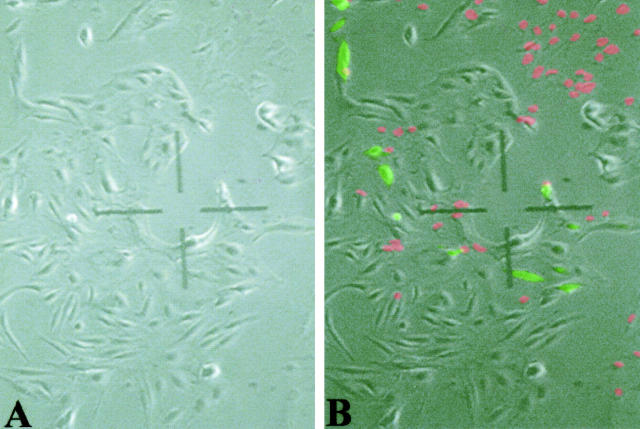
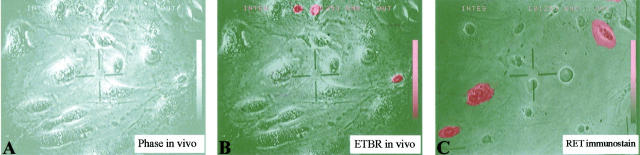
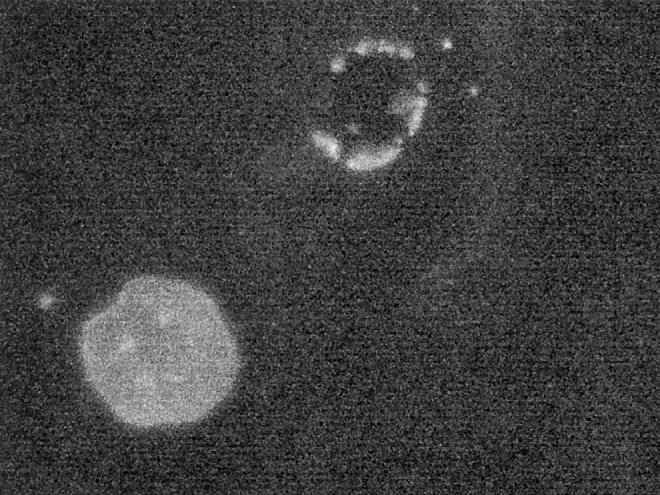
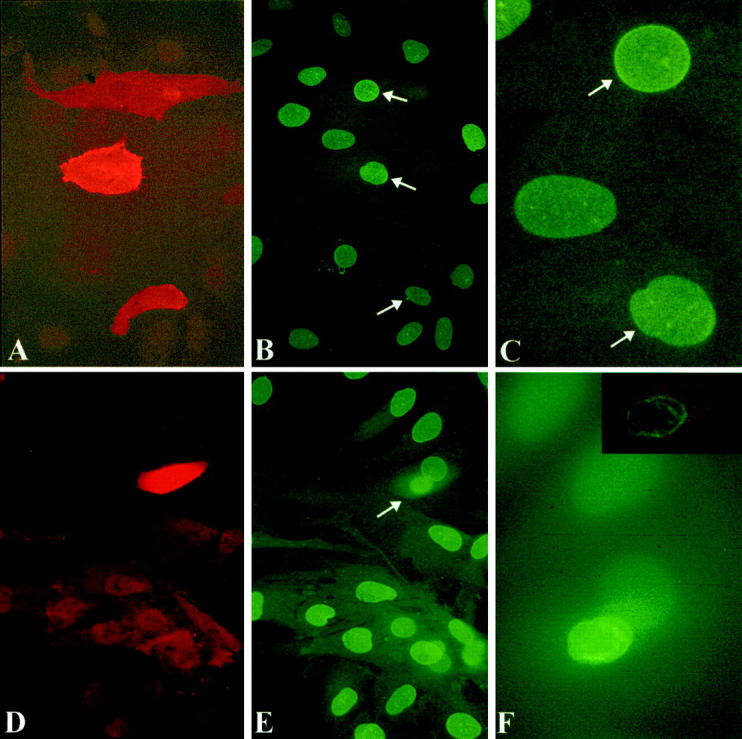
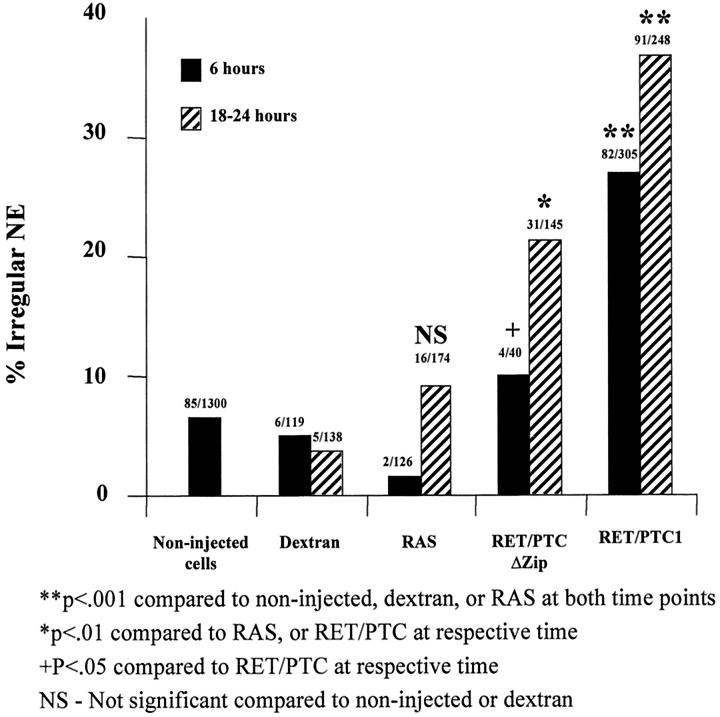
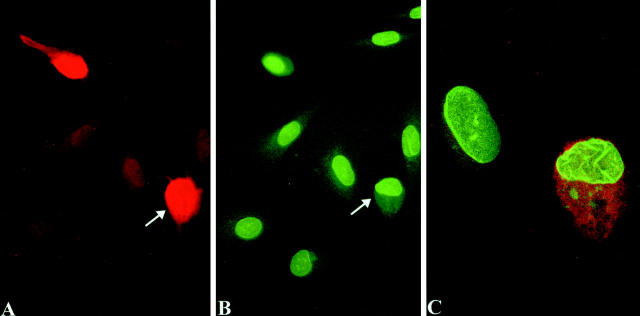
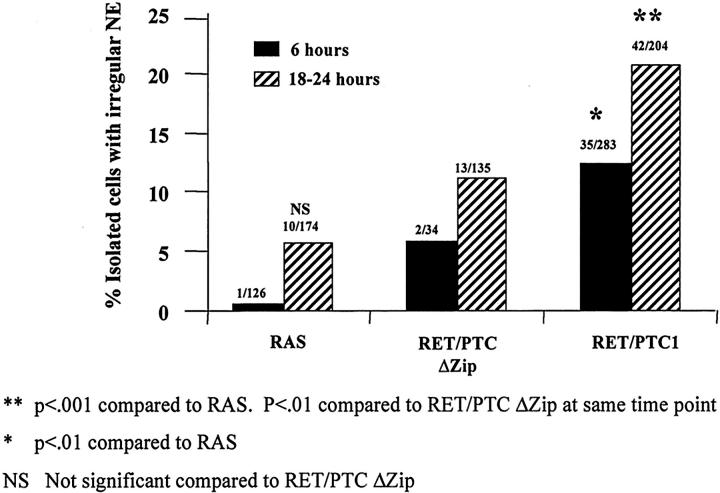
Nuclear envelope (NE) irregularity is an important diagnostic feature of cancer, and its molecular basis is not understood. One possible cause is abnormal postmitotic NE re-assembly, such that a rounded contour is never achieved before the next mitosis. Alternatively, dynamic forces could deform the NE during interphase following an otherwise normal postmitotic NE re-assembly. To distinguish these possibilities, normal human thyroid epithelial cells were microinjected with the papillary thyroid carcinoma oncogene (RET/PTC1 short isoform, known to induce NE irregularity), an attenuated version of RET/PTC1 lacking the leucine zipper dimerization domain (RET/PTC1 Deltazip), H (V-12) RAS, and labeled dextran. Cells were fixed at 6 or 18 to 24 hours, stained for lamins and the products of microinjected plasmids, and scored blindly using previously defined criteria for NE irregularity. 6.5% of non-injected thyrocytes showed NE irregularity. Neither dextran nor RAS microinjections increased NE irregularity. In contrast, RET/PTC1 microinjection induced NE irregularity in 27% of cells at 6 hours and 37% of cells at 18 to 24 hours. RET/PTC1 Deltazip induced significantly less irregularity. Since irregularity develops quickly, and since no mitoses and only rare possible postmitotic cells were scored, postmitotic NE re-assembly does not appear necessary for RET/PTC signaling to induce an irregular NE contour.
Figures
Similar articles
-
Role of H2O2 in RET/PTC1 chromosomal rearrangement produced by ionizing radiation in human thyroid cells.Cancer Res. 2010 May 15;70(10):4123-32. doi: 10.1158/0008-5472.CAN-09-4336. Epub 2010 Apr 27. Cancer Res. 2010. PMID: 20424115
-
Early cellular abnormalities induced by RET/PTC1 oncogene in thyroid-targeted transgenic mice.Oncogene. 1999 Jun 17;18(24):3659-65. doi: 10.1038/sj.onc.1202709. Oncogene. 1999. PMID: 10380889
-
Molecular aspects of diagnostic nucleolar and nuclear envelope changes in prostate cancer.J Cell Biochem. 2004 Jan 1;91(1):170-84. doi: 10.1002/jcb.10735. J Cell Biochem. 2004. PMID: 14689589 Review.
-
XB130, a tissue-specific adaptor protein that couples the RET/PTC oncogenic kinase to PI 3-kinase pathway.Oncogene. 2009 Feb 19;28(7):937-49. doi: 10.1038/onc.2008.447. Epub 2008 Dec 8. Oncogene. 2009. PMID: 19060924
-
Nuclear envelope dynamics.Biochem Cell Biol. 2001;79(5):533-42. Biochem Cell Biol. 2001. PMID: 11716295 Review.
Cited by
-
Loss of A-type lamin expression compromises nuclear envelope integrity in breast cancer.Chin J Cancer. 2011 Jun;30(6):415-25. doi: 10.5732/cjc.010.10566. Chin J Cancer. 2011. PMID: 21627864 Free PMC article.
-
The induction of a nucleoplasmic reticulum by prelamin A accumulation requires CTP:phosphocholine cytidylyltransferase-α.J Cell Sci. 2011 Dec 15;124(Pt 24):4253-66. doi: 10.1242/jcs.091009. Epub 2012 Jan 5. J Cell Sci. 2011. PMID: 22223883 Free PMC article.
-
Defective Nuclear Lamina in Aneuploidy and Carcinogenesis.Front Oncol. 2018 Nov 20;8:529. doi: 10.3389/fonc.2018.00529. eCollection 2018. Front Oncol. 2018. PMID: 30524960 Free PMC article. Review.
-
Nuclear assembly as a target for anti-cancer therapies.Nucleus. 2014 Jan-Feb;5(1):47-55. doi: 10.4161/nucl.27928. Epub 2014 Jan 27. Nucleus. 2014. PMID: 24637400 Free PMC article. Review.
-
Nuclear envelope structural defect underlies the main cause of aneuploidy in ovarian carcinogenesis.BMC Cell Biol. 2016 Nov 22;17(1):37. doi: 10.1186/s12860-016-0114-8. BMC Cell Biol. 2016. PMID: 27875985 Free PMC article.
References
-
- Aitchison JD, Rout MP: A tense time for the nuclear envelope. Cell 2002, 108:301-304 - PubMed
-
- Hutchison CJ, Alvarez-Reyes M, Vaughan OA: Lamins in disease: why do ubiquitously expressed nuclear envelope proteins give rise to tissue-specific disease phenotypes? J Cell Sci 2001, 114:9-19 - PubMed
-
- Fischer AH, Taysavang P, Weber C, Wilson K: Nuclear envelope organization in papillary thyroid carcinoma. Histol Histopathol 2001, 16:1-14 - PubMed
-
- Wilson KL: The nuclear envelope, muscular dystrophy, and gene expression. Trends Cell Biol 2000, 10:125-129 - PubMed
-
- Worman HJ, Courvalin JC: The inner nuclear membrane. J Membr Biol 2000, 177:1-11 - PubMed
MeSH terms
Substances
LinkOut - more resources
Full Text Sources
