. 2003 Sep;163(3):1193-200.
doi: 10.1016/S0002-9440(10)63479-7.

Human monoclonal antiphospholipid antibodies disrupt the annexin A5 anticoagulant crystal shield on phospholipid bilayers: evidence from atomic force microscopy and functional assay

Affiliations

Human monoclonal antiphospholipid antibodies disrupt the annexin A5 anticoagulant crystal shield on phospholipid bilayers: evidence from atomic force microscopy and functional assay

Jacob H Rand et al. Am J Pathol. 2003 Sep.

Abstract

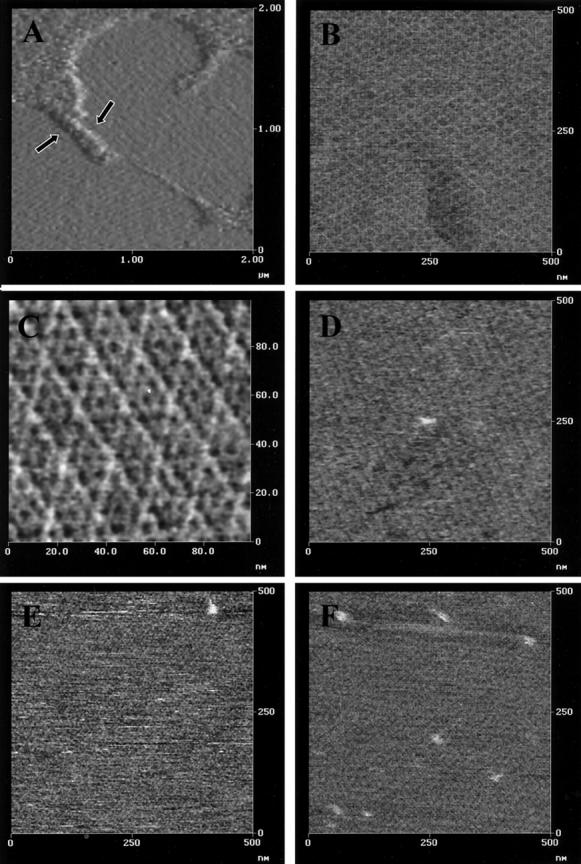
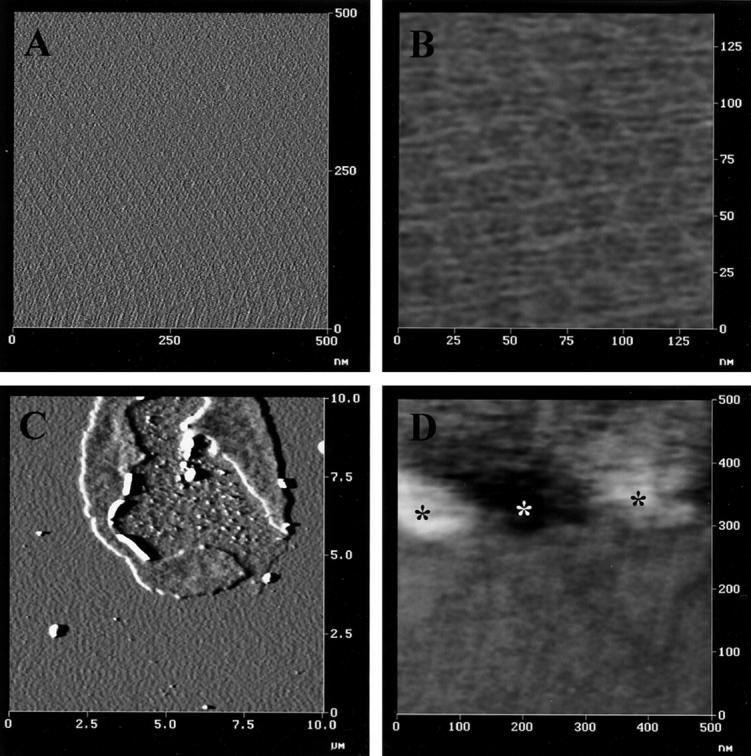
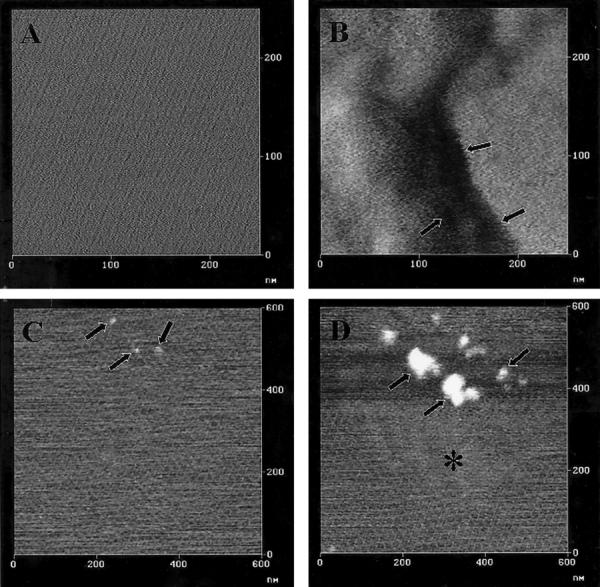
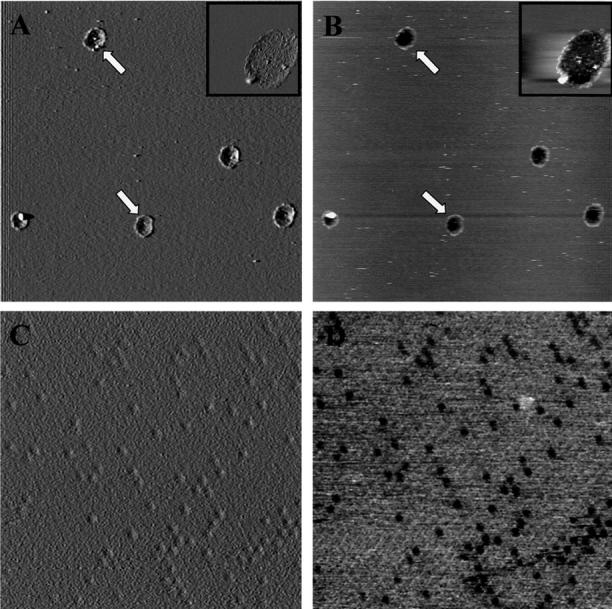
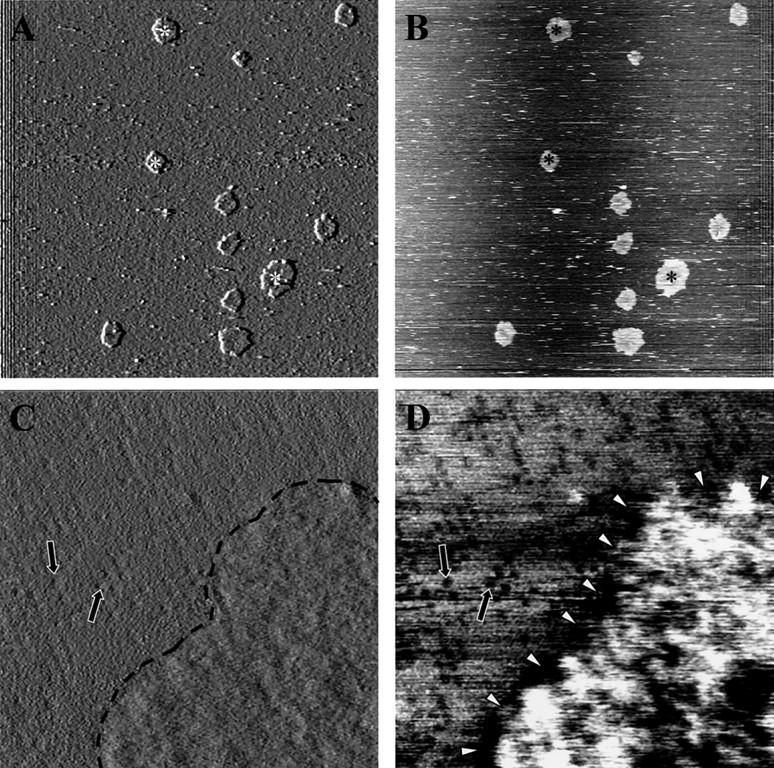
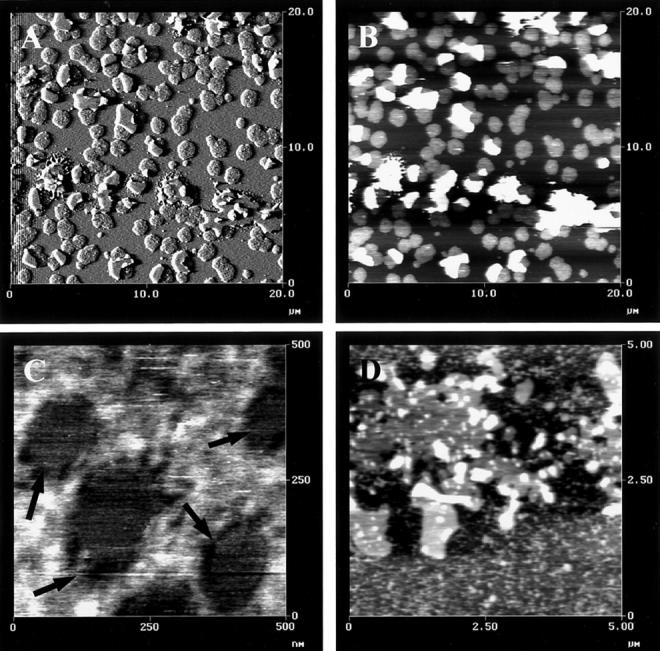
The antiphospholipid (aPL) syndrome is an autoimmune condition that is marked by recurrent pregnancy losses and/or systemic vascular thrombosis in patients who have antibodies against phospholipid/co-factor complexes. The mechanism(s) for pregnancy losses and thrombosis in this condition is (are) not known. Annexin A5 is a potent anticoagulant protein, expressed by placental trophoblasts and endothelial cells, that crystallizes over anionic phospholipids, shielding them from availability for coagulation reactions. We previously presented data supporting the hypothesis that aPL antibody-mediated disruption of the anticoagulant annexin A5 shield could be a thrombogenic mechanism in the aPL syndrome. However, this has remained a subject of controversy. We therefore used atomic force microscopy, a method previously used to study the crystallization of annexin A5, to image the effects of monoclonal human aPL antibodies on the crystal structure of the protein over phospholipid bilayers. In the presence of the aPL monoclonal antibodies (mAbs) and beta(2)-GPI, the major aPL co-factor, structures presumed to be aPL mAb-antigen complexes were associated with varying degrees of disruption to the annexin A5 crystallization pattern over the bilayer. In addition, measurements of prothrombinase activity on the phospholipid bilayers showed that the aPL mAbs reduced the anti-coagulant effect of annexin A5 and promoted thrombin generation. These data provide morphological evidence that support the hypothesis that aPL antibodies can disrupt annexin A5 binding to phospholipid membranes and permit increased generation of thrombin. The aPL antibody-mediated disruption of the annexin A5 anticoagulant shield may be an important prothrombotic mechanism in the aPL syndrome.


Figures

Figure 1.
Figure 1.
Annexin A5 crystal structure. AFM images demonstrating the formation of an annexin A5 2-D crystal lattice on a planar phospholipid bilayer, and no effects of β2-GPI and a human control IgG antibody on the annexin A5 2-D crystal lattice. Amplitude image (A) shows irregular furrows (arrows) between annexin A5 lattices that are growing from different nucleation sites. Height images (B, C) show the completed 2-D crystalline lattice at different magnifications. The 100 nm × 100 nm zoomed height image (C) demonstrates the annexin A5 crystal lattice at a high resolution. In dynamic imaging experiments, the annexin A5 lattice is not affected by the addition of β2-GPI after 60 minutes of scanning (D); addition of control mAb IgG1 and β2-GPI to the annexin A5-covered bilayer also shows no effect on the crystal lattice (E). In an endpoint experiment, pretreatment of PS/PC bilayer with IgG1 and β2-GPI does not inhibit the formation of the annexin A5 2-D crystal lattice (F). Amplitude image (A) was processed with ×1 convolution; the height image (C) was zero-flattened and low-pass filtered; the height images (B, E, F) were processed by zero order flatten mode.
Figure 2.
Figure 2.
Sequential effects of β2-GPI and IS3 on annexin A5 crystal structure. AFM images from a dynamic imaging experiment showing the effect of aPL mAb IS3 on a preformed annexin A5 crystalline lattice. The addition of β2-GPI alone has no discernible effect on the crystal lattice as observed using amplitude imaging (A) and at higher magnification with height imaging (B). On the subsequent addition of IS3, circular deformities appeared indicating disruption of the crystal lattice as seen in an amplitude image (C). A height image (D) within the circular deformities shows dark areas (white asterisk) representing portions of the surface that have lost annexin A5 coverage, near light areas (black asterisks) representing elevated structures, presumably antibody-antigen complexes. A and C: Amplitude images processed with a ×1 convolution. B and D: Height images processed with a zero order flatten and low-pass filter.
Figure 3.
Figure 3.
Effects of other aPL mAbs on annexin A5 crystal structure. AFM images showing the effect of other aPL mAbs on previously formed annexin A5 2-D crystal in dynamic experiments. A and C: Annexin A5 surface in the presence of mAbs CL15 and CL1 before the addition of β2-GPI. After the addition of β2-GPI, CL15 grossly disrupts the annexin A5 crystal (B), forming large furrows (arrows), represented by dark areas. Note that in C the addition of mAb CL1 to the annexin A5 layer does not alter the structural integrity of the lattice in the absence of β2-GPI, but a few globular structures appear (arrows). D: On addition of co-factor β2-GPI, the globules enlarge (arrows) and the crystal structure is minimally disrupted (asterisk). Images (B–D) are height images with off-line zero-flatten and low-pass filtering applied; image in A is an amplitude image with no processing.
Figure 4.
Figure 4.
AFM images from endpoint-imaging experiments showing the effect of aPL mAb IS3 on a preformed annexin A5 crystal lattice. When IS3 and β2-GPI were added to the annexin A5 crystal lattice formed on the bilayer, circular pits appeared (arrows in A and B) indicating disruptions in the crystal lattice similar to those observed in the dynamic imaging experiments (Figure 2) ▶ . A representative pit is shown at higher magnification in the insets. Moreover, at higher resolution (C, D) more vacancy defects (small round dark holes) in the crystalline lattice are apparent. Amplitude images (A, C) processed with a ×1 convolution and height images (B, D) processed by zero order flatten. Original magnifications: 10 μm × 10 μm scan (A, B); 500 nm × 500 nm (C, D).
Figure 5.
Figure 5.
AFM images showing the effect of aPL mAb CL1, together with β2-GPI on previously formed annexin A5 crystal in endpoint experiments. Amplitude images (A, C) are presented with corresponding height images (B, D). At a low magnification of 20 μm × 20 μm scan (A, B), large aggregates (asterisks) presumably representing antibody/co-factor complexes are seen on the annexin A5 lattice. At higher magnification (500 nm × 500 nm scan) (C, D), displacement of the annexin A5 crystalline lattice at the site of CL1 + β2-GP1 interaction is observed (arrowheads) with further disruption of the crystalline lattice indicated by an increased number of vacancy defects (arrows). The site of disruption is highlighted by the broken line in C. Images were minimally processed with off-line functions zero-flatten and erase scan line.
Figure 6.
Figure 6.
AFM images from endpoint experiments demonstrating effect of aPL mAb IS3, CL1, and CL15 on the subsequent formation of annexin A5 crystal. When annexin A5 is added to a planar phospholipid bilayer that had been preincubated with IS3 and β2-GPI, large aggregates formed over the phospholipid layer, but no annexin A5 crystal lattice is detected (A, B). aPL mAb CL1 shows a homogeneous disruptive effect on the forming annexin A5 crystal lattice (C), with large dark areas representing surface on which annexin A5 is not crystallized (arrows), whereas aPL mAb CL15 displays a grossly disruptive effect on the forming annexin A5 (D) leaving large dark patches uncovered by annexin A5. Amplitude image (A) was processed with a ×1 convolution, height image (B) processed by zero order flatten, and height images (C, D) processed by zero-flatten, erase scan lines, and contrast enhancement.

References

    1. Hughes GR: Hughes’ syndrome: the antiphospholipid syndrome. A historical view Lupus 1998, 7:S1-S4 - PubMed
    1. Rand JH: The antiphospholipid syndrome Annu Rev Med 2003, 54:409-424 - PubMed
    1. Rand JH: Molecular pathogenesis of the antiphospholipid syndrome Circ Res 2002, 90:29-37 - PubMed
    1. Funakoshi T, Heimark RL, Hendrickson LE, McMullen BA, Fujikawa K: Human placental anticoagulant protein: isolation and characterization Biochemistry 1987, 26:5572-5578 - PubMed
    1. Tait JF, Sakata M, McMullen BA, Miao CH, Funakoshi T, Hendrickson LE, Fujikawa K: Placental anticoagulant proteins: isolation and comparative characterization four members of the lipocortin family Biochemistry 1988, 27:6268-6276 - PubMed

Publication types