. 2003 Nov 1;552(Pt 3):743-61.
doi: 10.1113/jphysiol.2003.043612. Epub 2003 Aug 22.

Sodium and calcium currents shape action potentials in immature mouse inner hair cells

Affiliations

Sodium and calcium currents shape action potentials in immature mouse inner hair cells

Walter Marcotti et al. J Physiol. .

Abstract

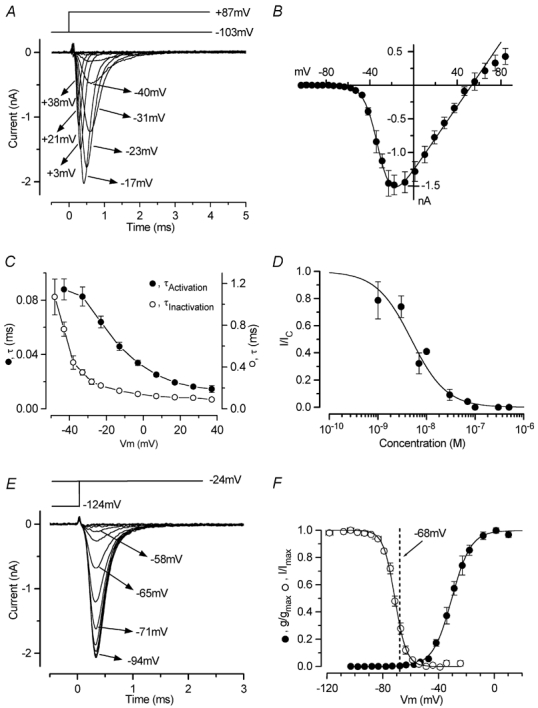
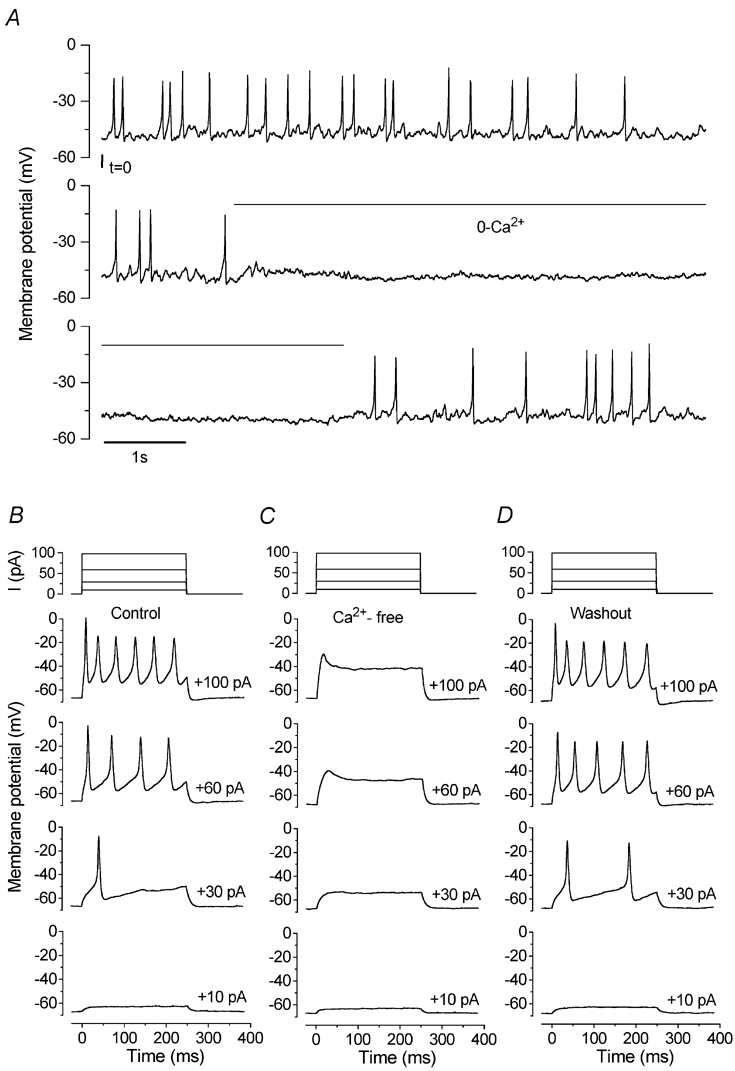
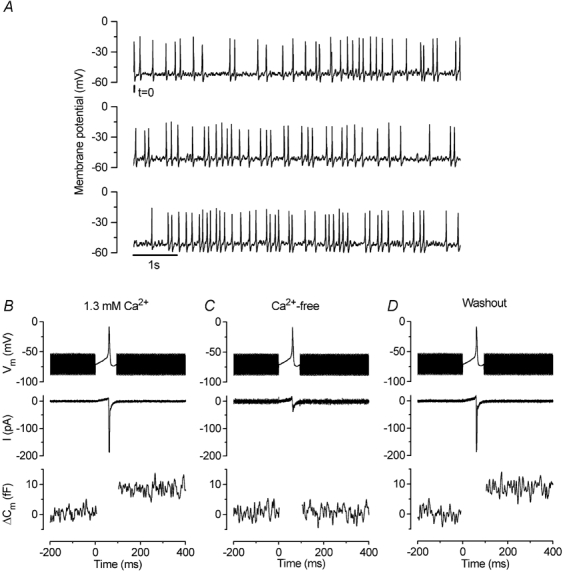
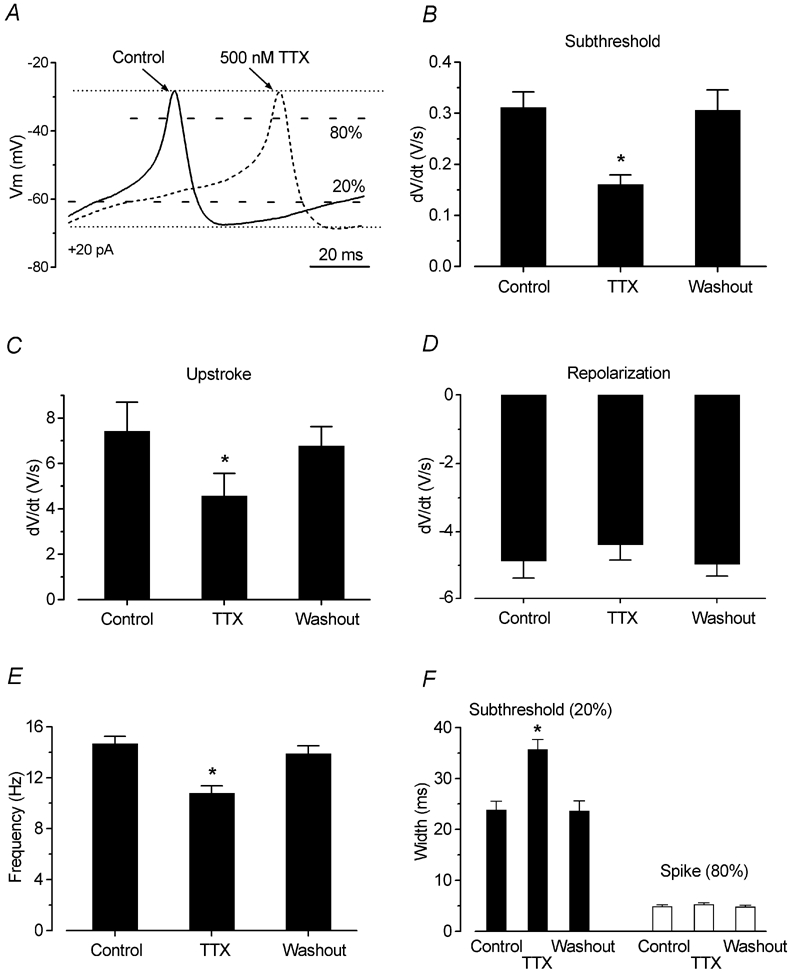
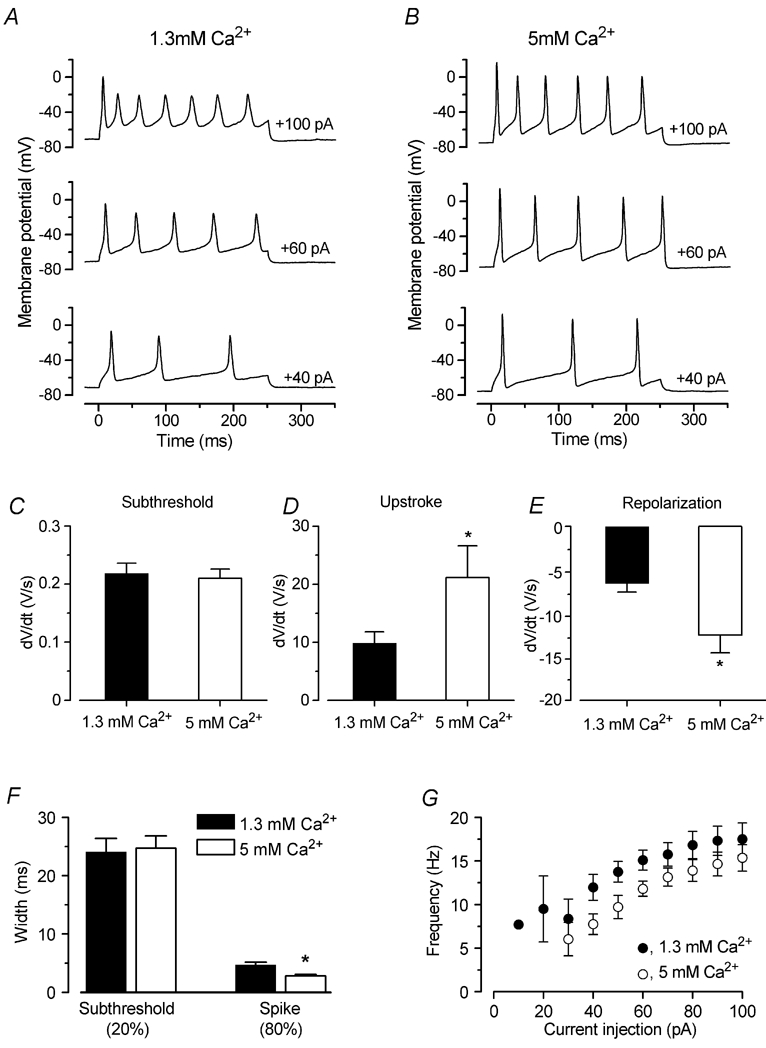
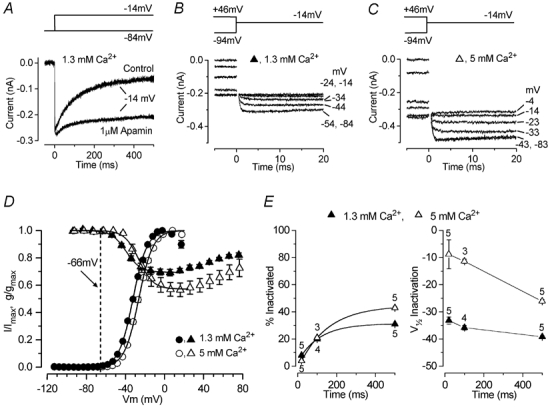
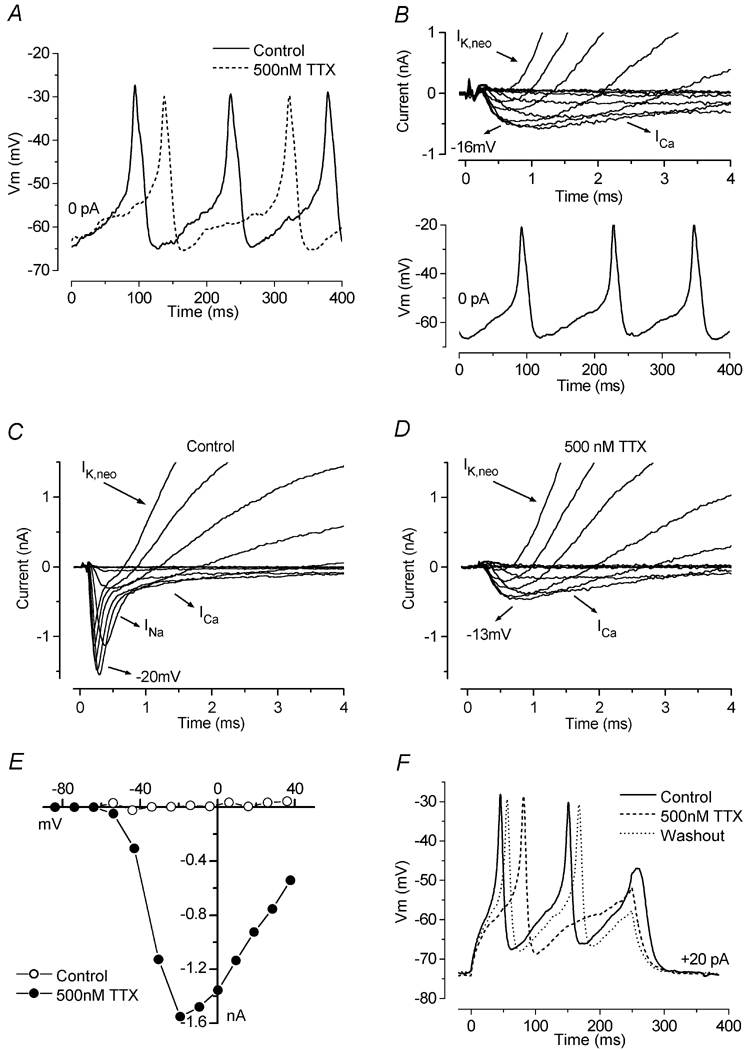
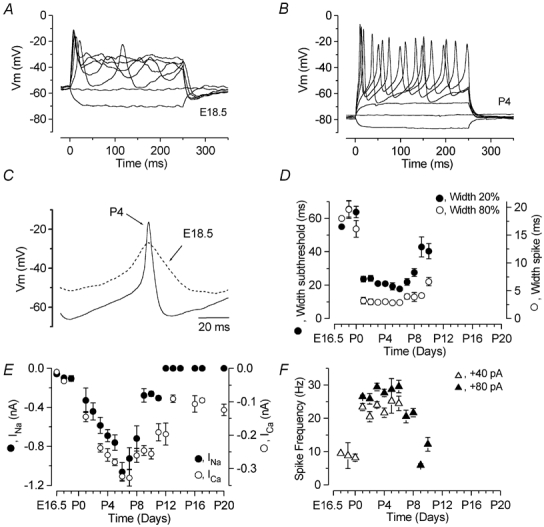
Before the onset of hearing at postnatal day 12, mouse inner hair cells (IHCs) produce spontaneous and evoked action potentials. These spikes are likely to induce neurotransmitter release onto auditory nerve fibres. Since immature IHCs express both alpha1D (Cav1.3) Ca2+ and Na+ currents that activate near the resting potential, we examined whether these two conductances are involved in shaping the action potentials. Both had extremely rapid activation kinetics, followed by fast and complete voltage-dependent inactivation for the Na+ current, and slower, partially Ca2+-dependent inactivation for the Ca2+ current. Only the Ca2+ current is necessary for spontaneous and induced action potentials, and 29 % of cells lacked a Na+ current. The Na+ current does, however, shorten the time to reach the action-potential threshold, whereas the Ca2+ current is mainly involved, together with the K+ currents, in determining the speed and size of the spikes. Both currents increased in size up to the end of the first postnatal week. After this, the Ca2+ current reduced to about 30 % of its maximum size and persisted in mature IHCs. The Na+ current was downregulated around the onset of hearing, when the spiking is also known to disappear. Although the Na+ current was observed as early as embryonic day 16.5, its role in action-potential generation was only evident from just after birth, when the resting membrane potential became sufficiently negative to remove a sizeable fraction of the inactivation (half inactivation was at -71 mV). The size of both currents was positively correlated with the developmental change in action-potential frequency.


Figures

Figure 6
Figure 6. INa in immature IHCs
A, INa recorded from a P6 IHC by applying depolarizing voltage steps from a holding potential of −103 mV. For clarity, only some of the traces are shown and some of the potentials are shown next to the traces. INa was isolated by subtracting the current during superfusion of TTX (300 nm) from the control current (also for the inactivation in E). Current recordings are averages of five repetitions. B, peak I-V curve for INa recorded in eleven P6-P7 IHCs (including the cell shown in A). The fitting parameters are: gmax 23.8 nS, Vrev+53.0 mV, V1/2−31.3 mV, S 6.3 mV. C, time constants of activation (•) and inactivation (○) for INa measured in nine and six IHCs, respectively. D, dose-response curve for block of INa by TTX. IHCs were superfused with a range of concentrations of TTX (between 1 and 500 nm), which reversibly blocked INa. Logistic curve: I/Icontrol= 1/(1 + ([D]/KD)nH), fitted with KD= 4.8 ± 0.6 nm and nH= 1.2 ± 0.2. [D] is the drug concentration. The number of cells from left to right: 2, 2, 3, 1, 3, 1, 1, 2, 4. The temperature was 22–24°C. E, peak INa at a membrane potential of −24 mV, following a series of 50 ms conditioning steps from −124 mV to more positive values in 5 or 10 mV increments, from a holding potential of −84 mV. Time zero is the start of the test step; the currents at the end of the preceding conditioning steps are also shown. Some of the values of the conditioning potentials are shown next to the traces. Recordings are averages of four repetitions. Recordings from A and E are from the same IHC, and the recording conditions were: Cm 8.6 pF; Rs 1.5 MΩ; gleak 1.8 nS; temperature 36°C. F, activation (•) and inactivation (○) curves for INa, from eleven P6-P7 and six P6 IHCs, respectively. The dashed line is −68 mV, the average resting membrane potential for P6-P7 apical-coil IHCs. The fitting parameters are: •, gmax 23.8 nS, V1/2−30.5 mV, S 6.9 mV; ○, Imax−1550 pA, V1/2−71.4 mV, S 4.2 mV.
Figure 2
Figure 2. Action potentials in immature IHCs are Ca2+ dependent
A, spontaneous action potentials are reversibly abolished in the absence of extracellular Ca2+. The recording conditions were: Vm−62 mV; temperature 23°C. B, depolarizing current steps trigger action potentials in a P7 IHC. Current steps were applied from the resting potential in 10 pA increments between 0 and +100 pA, and for clarity only a few voltage responses are shown. The interval between spikes decreased with increasing current size. C, superfusion of the cell in B with nominally Ca2+-free solution completely suppressed the regenerative responses to depolarizing current injection. D, action potentials after washout. Current recordings in B-D at the top of each column show the good quality of the current clamp. All voltage responses in this and the following figures are single traces. The recording conditions were: Vm−68 mV; Cm 8.0 pF; Rs 2.3 MΩ, gleak 1.2 nS; temperature 36°C.
Figure 1
Figure 1. Spontaneous action potentials in immature IHCs are sufficient to induce exocytosis
A, continuous recording of voltage responses from an apical-coil P3 IHC using 1.3 mm Ca2+ in the extracellular solution. The total duration of the recording is 22.5 s and the recording conditions were: resting membrane potential (Vm) −54 mV; Cm 7.4 pF; Rs 7.1 MΩ; leak conductance (gleak) 1.0 nS; temperature 37°C. B-D, current and ΔCm responses of a P1 apical IHC to a voltage-clamp action potential protocol before, during and after superfusion of a Ca2+-free solution. Holding potential −71 mV. Command protocols (top panels) consisted of a 2.5 kHz sinusoidal waveform (used to track Cm) that was interrupted for the duration of the action potential. Inward ICa (middle panels) elicited by the action-potential protocol. Peak inward currents were: −187 pA in A; −37 pA in B; −186 pA in C. The lower panels show the corresponding ΔCm (the region during the action potential is omitted as the track-in circuitry is not operational during this period). The ΔCm values are: 8.6 fF in A; 0.6 fF in B; 8.7 fF in C. The recording conditions were: Cm 7.8 pF; Rs 5.2 MΩ; gleak 0.8 nS; temperature 37°C.
Figure 8
Figure 8. Quantitative effects of TTX on action-potential timing
A, enlarged representation of voltage responses from Fig. 7F before (continuous line) and during (dashed line) superfusion of TTX. The 20 % and 80 % labels indicate the height at which the widths of the action potentials were measured, between the peak and the maximum repolarization levels (dotted lines). B, C and D, rate of subthreshold depolarization, upstroke and repolarization, respectively, of the action potentials before, during and after extracellular application of 300–500 nm TTX (n = 14). E, change in spike frequency during extracellular superfusion of TTX. F, width of the action potentials measured at the two levels shown in A.
Figure 4
Figure 4. ICa in immature IHCs
A and B, inward ICa recordings from a P6 IHC during superfusion of 1.3 mm (A) and 5 mm (B) extracellular Ca2+, in response to voltage steps from −113 mV to more depolarized potentials in 5 or 10 mV increments. The holding potential was −103 mV. A schematic representation of the voltage protocol is shown above the current traces. For clarity, only some of the traces are shown and some of the potentials are shown next to the traces. Residual capacitative transients have been blanked. The extracellular solution contained 30 mm TEA and 200 nm TTX. Currents in A and B are averages from six and four repetitions, respectively. The recording conditions were: Cm 7.7 pF; Rs 4.8 MΩ; gleak 1.3 nS; temperature 37°C. C, average peak I-V curves for seven P6-P7 IHCs during extracellular superfusion of 1.3 (•) and 5 mm (○) Ca2+ (including the cell shown in A and B). The continuous lines are fits calculated using eqn (1) (see text for details). The fitting parameters are: in 1.3 mm Ca2+, gmax 7.0 nS, Vrev 45 mV, V1/2−32.8 mV, S 6.9 mV; in 5 mm Ca2+, gmax 13.0 nS, Vrev 45 mV, V1/2−26.7 mV, S 6.9 mV. D, time constants of activation for ICa measured in the same seven IHCs.
Figure 3
Figure 3. Ca2+ speeds up the upstroke of the action potential
A and B, voltage responses from an IHC before and during superfusion of 1.3 and 5 mm extracellular Ca2+, respectively. Current steps were applied in 10 mV increments up to +100 pA, and for clarity only a few examples are shown. Note that in the presence of 5 mm Ca2+ the action potentials became faster and reached a more depolarized potential. The recording conditions were: P7, Cm 8.4 pF; Rs 5.0 MΩ; temperature 37°C. C-E, rate of the subthreshold depolarization, and the rise and fall of the action potentials, respectively, during superfusion of 1.3 and 5 mm Ca2+ (P7, n = 8). F, widths measured at the subthreshold (20 %) and spike (80 %) level as shown in Fig. 8A (dashed lines). G, frequency of evoked action potentials before and during superfusion of 5 mm Ca2+ as a function of depolarizing current injection (P7, n = 8).
Figure 5
Figure 5. Activation and inactivation of ICa in immature IHCs
A, inward currents in a P5 IHC during 500 ms depolarizing steps to −14 mV from a holding potential of −84 mV, before and during extracellular application of 1 μm apamin. Extracellular Ca2+ was 1.3 mm throughout the experiment. Recordings are single traces. B and C, tail currents at a membrane potential of −14 mV were used to derive the inactivation curves (see text for details). Some of the conditioning voltages are shown next to the traces. Residual capacitative transients were blanked. Conditioning steps were 500 ms in duration from −94 mV to more positive values in 10 mV increments. The holding potential was −84 mV. B and C are both averages from two repetitions. Recordings in A-C are from the same IHC, and the recording conditions were: Cm 7.0 pF; Rs 7.2 MΩ; gleak 1.7 nS; temperature 37°C. D, activation of ICa from seven P6-P7 IHCs (circles),including the cell shown in Fig. 4A and B, and inactivation of ICa from five P5 IHCs (triangles), including the cell shown in B and C, in 1.3 and 5 mm extracellular Ca2+. Inactivation followed 500 ms conditioning steps. The dashed line is −66 mV, the average resting membrane potential for P5-P7 apical-coil IHCs. The continuous lines are fits calculated using eqn (3) for activation and eqn (4) for inactivation (see text for details). The fitting parameters for activation are: in 1.3 mm Ca2+ (•), gmax7.0 nS, V1/2-32.3 mV, S 7.2 mV; in 5 mm Ca2+ (○), gmax 13.0 nS, V1/2−26.4 mV, S 7.3 mV. Parameters for inactivation were: in 1.3 mm Ca2+ (▴), Imax−316 pA, Iconst 0.69 Imax, V1/2−39.2 mV, S 7.4 mV; in 5 mm Ca2+ (▵), Imax−510 pA, Iconst 0.57 Imax, V1/2−26.1 mV, S 7.3 mV. E, percentage of inactivation and V1/2 of inactivation (derived from the fit of the inactivation curves using eqn (4)) when 20, 100 and 500 ms conditioning pulses were applied in the same P5 IHCs using 1.3 and 5 mm extracellular Ca2+.
Figure 7
Figure 7. Contribution of INa to IHC action potentials
A, spontaneous action potentials from a P4 IHC before and during superfusion of 500 nm TTX. The recording conditions were: Vm−61 mV; Cm 7.1 pF; Rs 5.9 MΩ, gleak 0.7 nS; temperature 37°C. B, currents recorded under voltage-clamp conditions (top) and spontaneous action potentials (below) recorded from a P2 IHC. This cell lacked INa. The recording conditions were: Vm−64 mV; Cm 6.5 pF; Rs 5.6 MΩ, gleak 2.4 nS; temperature 35°C. C and D, membrane currents elicited by using nominally 10 mV voltage steps, from a P4 IHC before (C) and during (D) superfusion of 500 nm TTX from a holding potential of −84 mV. Actual membrane potentials corrected for the voltage drop across Rs are shown for the peak inward current only. In C, note the presence of both inward INa and ICa and the much slower outward IK,neo. During superfusion of TTX, the fast INa was completely blocked (D). Recordings in C and D are single traces. E, peak I-V curve (•) for the inward currents shown in C. The current values for the traces in D (○) were obtained at the same time point used for values in C. F, voltage responses from the same cell shown in C and D before, during and after superfusion of 500 nm TTX. Note that in the presence of the drug the spike frequency is reduced. All current and voltage responses are single traces. The recording conditions were: Vm−74 mV; Cm 6.8 pF; Rs 3.1 MΩ, gleak 2.2 nS; temperature 36.5°C.
Figure 9
Figure 9. Changes in spike frequency and INa and ICa during IHC maturation
A and B, voltage responses from IHCs at E18.5 (A) and P4 (B). C, single action potential from recordings in A and B. The recording conditions for A were: Vm−57 mV; Cm 7.1 pF; Rs 3.7 MΩ, gleak 0.8 nS; temperature 37°C. Those for B were: Vm−74 mV; Cm 7.5 pF; Rs 6.6 MΩ, gleak 1.2 nS; temperature 37°C. D, developmental changes of the width measured at both the subthreshold (•, width at 20 %) and spike (○, 80 %) levels. Numbers of cells (E17.5-P10): 1, 2, 2, 2, 7, 18, 15, 4, 6, 14, 4, 3, 5. E, development of the peak INa and ICa in apical-coil IHCs. Numbers of cells showing INa/total number of cells investigated at the various ages: •, (E16.5-P20) 3/5, 1/4, 3/3, 4/5, 4/5, 11/12, 12/13, 15/17, 20/25, 18/22, 5/5, 4/14, 4/12, 3/9, 0/5, 0/4, 0/1, 0/3, 0/4, 0/3. Only cells exhibiting the INa are included in the averages. Numbers of cells for ICa (○, E16.5-P20): 3, 2, 3, 7, 11, 22, 28, 12, 4, 10, 15, 9, 5, 4, 3, 4, 3. F, changes in spike frequency under current-clamp conditions from apical-coil IHCs during development. Values were measured at +40 and +80 pA current injection from the resting potential in order to follow the changes in spike frequency during early and later stages of development, respectively. The temperature in all cells investigated was between 35 and 37°C. Numbers of cells: ▵ (E17.5-P6, +40 pA) 1, 2, 2, 2, 7, 18, 15, 3, 6; ▴ (P1-P10, +80 pA) 2, 7, 18, 15, 4, 6, 14, 4, 3, 5.

Similar articles

Cited by

References

    1. Art JJ, Fettiplace R. Variation of membrane properties in hair cells isolated from the turtle cochlea. J Physiol. 1987;385:207–242. - PMC - PubMed
    1. Beutner D, Moser T. The presynaptic function of mouse cochlear inner hair cells during development of hearing. J Neurosci. 2001;21:4593–4599. - PMC - PubMed
    1. Blair NT, Bean BP. Roles of tetrodotoxin (TTX)-sensitive Na+ current, TTX-resistant Na+ current, and Ca2+ current in the action potentials of nociceptive sensory neurons. J Neurosci. 2002;22:10277–10290. - PMC - PubMed
    1. Blaustein MP, Goldman DE. The action of certain polyvalent cations on the voltage-clamped lobster axon. J Gen Physiol. 1968;51:279–291. - PMC - PubMed
    1. Brehm P, Eckert R. Calcium entry leads to inactivation of calcium channel in Paramecium. Science. 1978;202:1203–1206. - PubMed

Publication types

LinkOut - more resources