Measurement of rapid changes in cell volume by forward light scattering
- PMID: 12937987
- PMCID: PMC4118695
- DOI: 10.1007/s00424-003-1145-5
Measurement of rapid changes in cell volume by forward light scattering
Abstract
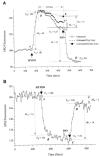
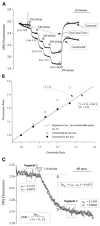
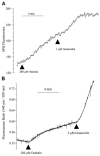
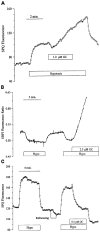
Light scattering is an empirical technique employed to measure rapid changes in cell volume. This study describes a new configuration for the method of light scattering and its corroboration by measurements of cell height (as a measure of cell volume). Corneal endothelial cells cultured on glass cover-slips were mounted in a perfusion chamber on the stage of an inverted microscope. A beam of light was focused on the cells from above the stage at an angle of 40 degrees to the plane of the stage. The scattered light intensity (SLI), captured by the objective and referred to as forward light scatter (FLS), increased and decreased in response to hyposmotic and hyperosmotic shocks, respectively. The rapid increase and decrease in SLI corresponded to cell swelling and shrinkage, respectively. Subsequently, SLI decreased and increased as expected for a regulatory volume decrease (RVD) and increase (RVI), respectively. These data are in agreement with measurements of cell height, demonstrating that the method of light scatter in FLS mode is useful for monitoring rapid changes in cell volume of cultured cells. Changes in SLI caused by gramicidin were consistent with cell volume changes induced by equilibration of NaCl and KCl concentrations across the cell membrane. Similarly, an additional decrease in SLI was recorded during RVD upon increasing K+ conductance by valinomycin. Decreasing K+ conductance of the cell membrane with Ba2+ changed the time course of SLI consistent with the effect of the K+ channel blocker on RVD. Bumetanide and dihydro-ouabain inhibited increases in SLI during RVI. In conclusion, FLS is a valid method for qualitative analysis of cell volume changes with a high time resolution.
Figures


Similar articles
-
Cell volume response to hyposmotic shock and elevated cAMP in bovine trabecular meshwork cells.Exp Eye Res. 2004 Jan;78(1):15-26. doi: 10.1016/j.exer.2003.10.001. Exp Eye Res. 2004. PMID: 14667824
-
Fluoxetine inhibits K(+) transport pathways (K(+) efflux, Na(+)-K(+)-2Cl(-) cotransport, and Na(+) pump) underlying volume regulation in corneal endothelial cells.J Membr Biol. 1999 Sep 1;171(1):75-85. doi: 10.1007/s002329900560. J Membr Biol. 1999. PMID: 10485996
-
Cell volume regulation in proximal renal tubules from trout (Salmo trutta).J Exp Biol. 1998 May;201(Pt 9):1405-19. doi: 10.1242/jeb.201.9.1405. J Exp Biol. 1998. PMID: 9547321
-
Receptor-mediated control of regulatory volume decrease (RVD) and apoptotic volume decrease (AVD).J Physiol. 2001 Apr 1;532(Pt 1):3-16. doi: 10.1111/j.1469-7793.2001.0003g.x. J Physiol. 2001. PMID: 11283221 Free PMC article. Review.
-
In Vivo Observations of Rapid Scattered Light Changes Associated with Neurophysiological Activity.In: Frostig RD, editor. In Vivo Optical Imaging of Brain Function. 2nd edition. Boca Raton (FL): CRC Press/Taylor & Francis; 2009. Chapter 5. In: Frostig RD, editor. In Vivo Optical Imaging of Brain Function. 2nd edition. Boca Raton (FL): CRC Press/Taylor & Francis; 2009. Chapter 5. PMID: 26844322 Free Books & Documents. Review.
Cited by
-
Dynamic regulation of barrier integrity of the corneal endothelium.Optom Vis Sci. 2010 Apr;87(4):E239-54. doi: 10.1097/OPX.0b013e3181d39464. Optom Vis Sci. 2010. PMID: 20142793 Free PMC article. Review.
-
Real-time monitoring of epithelial cell-cell and cell-substrate interactions by infrared surface plasmon spectroscopy.Biophys J. 2010 Dec 15;99(12):4028-36. doi: 10.1016/j.bpj.2010.10.017. Biophys J. 2010. PMID: 21156146 Free PMC article.
-
Lack of threshold for anisotonic cell volume regulation.J Membr Biol. 2006 May;211(1):27-33. doi: 10.1007/s00232-006-0002-9. Epub 2006 Sep 18. J Membr Biol. 2006. PMID: 16988859
-
Measurement of intrinsic optical backscattering characteristics of cells using fiber-guided near infrared light.Biomed Eng Online. 2010 Feb 25;9:12. doi: 10.1186/1475-925X-9-12. Biomed Eng Online. 2010. PMID: 20184751 Free PMC article.
-
A Note of Caution: Gramicidin Affects Signaling Pathways Independently of Its Effects on Plasma Membrane Conductance.Biomed Res Int. 2021 Oct 21;2021:2641068. doi: 10.1155/2021/2641068. eCollection 2021. Biomed Res Int. 2021. PMID: 34722759 Free PMC article.
References
-
- Adorante JS. Regulatory volume decrease in frog retinal pigment epithelium. Am J Physiol. 268 - PubMed
- Cell Physiol. 1995;37:C89–C100.
-
- Adorante JS, Cala PM. Mechanisms of regulatory volume decrease in nonpigmented human ciliary epithelial cells. Am J Physiol. 268 - PubMed
- Cell Physiol. 1995;37:C721–C731.
-
- Biwersi J, Farah N, Wang Y-X, Ketcham R, Verkman AS. Synthesis of cell-impermeable Cl-sensitive fluorescent indicators with improved sensitivity and optical properties. Am J Physiol. 262 - PubMed
- Cell Physiol. 1992;31:C243–C250.
-
- Biwersi J, Tulk B, Verkman AS. Long-wavelength chloride-sensitive fluorescent indicators. Anal Biochem. 1994;219:139–143. - PubMed
-
- Bonanno JA, Srinivas SP, Brown M. Effect of acetazolamide on intracellular pH and bicarbonate transport in bovine corneal endothelium. Exp Eye Res. 1995;60:425–434. - PubMed
Publication types
MeSH terms
Grants and funding
LinkOut - more resources
Full Text Sources

