. 2003 Aug 1;550(Pt 3):679-91.
doi: 10.1113/jphysiol.2003.043810.

Activation-dependent properties of pregnenolone sulfate inhibition of GABAA receptor-mediated current

Affiliations

Activation-dependent properties of pregnenolone sulfate inhibition of GABAA receptor-mediated current

Lawrence N Eisenman et al. J Physiol. .

Abstract

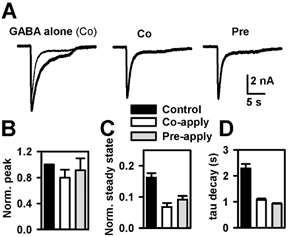
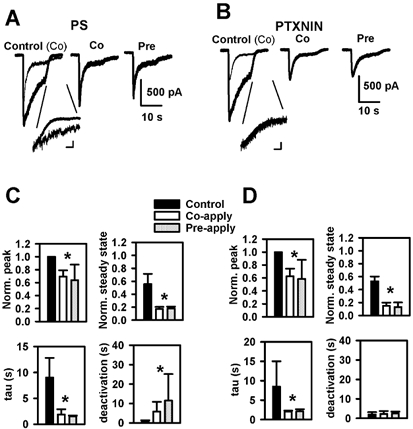
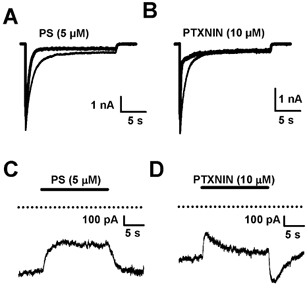
Sulfated steroids like pregnenolone sulfate (PS) are found endogenously in the central nervous system where they may modulate GABAA receptors. Understanding the mechanism of steroid inhibition is important for understanding the conditions under which endogenous steroids modulate GABAA receptor function, assessing their potential clinical utility, and for evaluating sulfated steroids as probes of receptor behaviour. Some previous studies suggest that sulfated steroid inhibition exhibits activation dependence, whilst other studies suggest only slow, time-dependent inhibition, perhaps reflecting slow PS association with receptors. We tested activation dependence in several ways. Steroid potency increased 2- to 3-fold with approximately 10-fold change in GABA concentration. PS inhibition of saturating partial agonist responses suggested that the level of channel activation, rather than receptor occupancy by agonist, is important for PS inhibition. Inhibition by sulfated steroids exhibited weak or no voltage dependence. Responses to rapid applications of exogenous GABA differed little whether PS was pre-applied or simply co-applied with GABA, consistent with the hypothesis that the actions of PS are facilitated by receptor activation. PS applied during steady-state GABA responses exhibited slow onset and offset rate constants. The offset, rather than onset, was significantly slowed by elevated GABA concentration. At hippocampal synapses, large, multiquantal IPSCs were inhibited more effectively by a fixed concentration of PS than small quantal content IPSCs, consistent with known 'pooling' of transmitter following multiquantal release. Picrotoxinin, although superficially similar to PS in its activation dependence, was dissimilar from PS in a number of details. In summary, PS inhibition exhibits activation dependence that may be explained by activation-dependent binding and altered desensitization.


Figures

Figure 8
Figure 8. PS inhibition depends on quantal content of hippocampal synaptic responses
A, autaptic IPSCs were either evoked in the presence of 4 mm Ca2+o (no added Mg2+o; top panel) or in the presence of 1 mm Ca2+o−3 mm Mg2+o (bottom panel). In interleaved trials, PS (5 μm) was pre-applied to synapses. Control IPSCs (PS absent) are shown as thin traces. IPSCs acquired in the presence of 5 μm PS are shown as thick traces. B, the effects of PS on IPSC peak amplitude and decay are summarized from 7 neurons stimulated under the conditions described in A. Because of the multi-exponential decay of IPSCs, 10–90 % decay time was used to quantify IPSC decays. Asterisks denote P < 0.05, two-tailed paired t test. C, TPMPA block of IPSCs is increased in low quantal content conditions. Ca2+ and Mg2+ concentrations were the same as for panel A. D, summary of TPMPA effects. (n = 5, P = 0.03). The control IPSC peak amplitude was 2.5 ± 0.7-fold larger in high Ca2+ than in low Ca2+.
Figure 5
Figure 5. GABA concentration dependence of inhibition onset and offset in hippocampal neurons
A, 2 μm GABA was applied for 20 s, followed by 10 s of GABA + PS (5 μm), then returned to GABA alone. The lower panels (grey traces) show the onset and offset of PS block at higher resolution. Superimposed (continuous black lines) are single exponential fits of time constants 594 ms (PS onset) and 856 ms (PS offset). B, same protocol from the same cell as in A, but using 20 μm GABA as the agonist. The fits are exponentials with time constants 721 ms (onset) and 1.72 s (PS offset). C and D, summary of the time constants of onset and offset of PS effect and picrotoxinin effect (10 μm) at 2 μm GABA (black columns) and 20 μm GABA (open columns) determined from single exponential fits. For PS, there was no significant difference between onset time constants in 2 or 20 μm GABA (n = 16; P > 0.3). Offset time constants were slowed by the increased GABA concentration (n = 16; P < 0.01, asterisk). For picrotoxinin, both onset and offset were significantly slowed at 20 μm GABA (asterisks, P < 0.01, n = 16). E, degree of steady- state block at 2 and 20 μm GABA in the same cells represented in C and D. Asterisk denotes P < 0.01. Both antagonists yielded larger block with increased GABA concentration. F, to estimate the speed of solution exchanges, during GABA application the Clo concentration in the bath solution was decreased to 50 % of that in the normal saline. Cells were clamped (+20 mV) near the reversal potential predicted by the low Clo concentration. The average time constant from 6 solution exchanges from 2 cells was 91.4 ± 14.6 ms.
Figure 1
Figure 1. PS inhibition of recombinant α1β2γ2L responses in Xenopus oocytes is associated with receptor activation
A, response of a voltage-clamped oocyte to application of 2.5 μm GABA alone (thick trace) and simultaneously co-applied PS (1.0 μm; thin trace). Clamp potential was - 70 mV. Arrows in A-C indicate the time point at which measurements of block were made. B, response in another oocyte to 30 μm GABA in the absence and presence of 1.0 μm PS. C, similar protocol as in A and B, but using a high concentration of the partial agonist P4S. D, summary inhibition curves from six cells using 30 μm GABA (○) and six additional cells challenged with 2.5 μm GABA (•). Grey triangles represent three cells challenged with 1 mm P4S. Error bars represent standard deviations, and the continuous lines represent fits of the Hill equation with IC50 values of 8.0, 0.36, and 1.42 μm for 2.5 and 30 μm GABA, and 1 mm P4S, respectively. The Hill slopes for the three curves were 0.9, 1.0, and 0.8, respectively. E, agonist concentration-response curves for peak response to GABA (•) and P4S (grey triangles) on the same set of five oocytes. Hill fits yielded estimates for the EC50 of 15.3 μm for GABA and 47.2 μm for P4S and Hill slopes of 2.56 and 0.8. F, from the concentration-response curves in E, functionally equivalent concentrations of 10 μm GABA and 1 mm P4S were chosen at which to evaluate the effect of 3 μm PS. Similar inhibitory effects were observed at the functionally equivalent concentrations. Inhibition was calculated as: IPS/Icontrol - 1, where Icontrol is the current at the end of a 30 s application of agonist alone and IPS is the current at the end of a 30 s co-application of agonist and PS.
Figure 2
Figure 2. Lack of voltage dependence of PS effects in Xenopus oocytes
A, voltage pulses to potentials between −90 and +90 mV from −70 mV (200 ms, 20 mV increments) were elicited in the absence and presence of 2 μm GABA. Currents in the absence of GABA were digitally subtracted from currents in the presence of GABA to yield the GABA responses shown. The dotted line indicates the zero current level. B, GABA responses from the same cell but in the presence of 2 μm PS. C, summary of the percentage inhibition of the steady-state GABA current at different membrane potentials. There was little change in inhibition over the potential range examined (•). Also shown is the block by a sulfated pregnane steroid, 3α5βPS. In contrast to PS, considerable voltage dependence was noted (○; n = 3 oocytes at 2 μm GABA and 30 μm 3α5βPS). Note that the missing point is at the GABA reversal potential, where there was no current to measure.
Figure 3
Figure 3. Time course of PS effects in cultured hippocampal neurons
Experiments were performed on primary cultures of hippocampal neurons, to permit faster exchange time of solutions than achievable on oocytes. A, the currents represent responses to 20 μm GABA. In the left panel, the current in response to co-application (Co) of 20 μm GABA and 2 μm PS is superimposed (thin trace) on the response to GABA alone (thick trace). In the middle panel, the response to co-applied GABA plus PS is re-plotted in isolation. In the right panel is the response to 20 μm GABA co-applied with 2 μm PS following a 20 s pre-application (Pre) of PS alone. B, summary of the effect of PS pre-application (grey columns) and co-application alone (open columns) on peak GABA response (n = 3). Responses were normalized to the peak GABA current in the absence of PS (black columns). C, summary of effects of pre-applied and co-applied PS on the steady-state current level relative to the control (GABA alone) peak response (same cells as in B). D, summary of PS effects on the apparent desensitization time constant (same cells as in B).
Figure 4
Figure 4. Comparison of co- and pre- application of PS and picrotoxinin (PTXNIN) on hippocampal neurons
A and B, protocols were performed as in Fig. 3, except that 5 μm GABA and 5 μm PS (A) or 10 μm picrotoxinin (B) was used. The insets for each panel highlight the deactivation time course of responses by showing the deactivation of current in the presence of antagonist scaled to the deactivation in the presence of agonist alone. Time calibration bars for the insets represent 1 s. Current calibrations for A inset represent 100 pA (GABA alone) and 34 pA (GABA + PS). Current calibrations for B inset represent 200 pA (GABA alone) and 21 pA (GABA + picrotoxinin). Note that deactivation curves for picrotoxinin superimpose almost exactly. C and D, bars denote effects as in Fig. 3 BD. Deactivation is the best exponential fit to the decay of the GABA current during washout of the GABA, antagonist combination. Summary data are from 5 cells treated with PS and 6 cells treated with picrotoxinin. Pre- and co-application conditions were different from control (asterisks) but did not differ from each other for each parameter. Note that PS and picrotoxinin had similar effects, except for effects on deactivation, where PS, but not picrotoxinin, significantly slowed deactivation.
Figure 6
Figure 6. Effect of PS concentration on onset and offset of block in hippocampal neurons
A-C, protocol was similar to that used in Fig. 5, except that GABA was kept constant at 5 μm, and PS concentration was varied from 2.5 to 20 μm. Statistical differences were evaluated with an ANOVA and are denoted by asterisks (P < 0.05). There was an effect of PS concentration on degree of block and a significant effect of PS on onset but not offset time constant (n = 14–22 cells at each concentration). DF, picrotoxinin (PTXNIN; 10 μm) was substituted for PS in the experimental protocol. Note that there was a significant effect of picrotoxinin concentration on both the degree of block and the onset time constant (n = 4 cells).
Figure 7
Figure 7. PS and picrotoxinin effects on responses to prolonged application of high GABA concentration in hippocampal neurons
A, PS (5 μm) alters the time course of response to 500 μm GABA and inhibits the steady-state response when co-applied with GABA. B, in contrast, co-application of picrotoxinin (PTXNIN 10 μm; thick trace) with 500 μm GABA speeds the initial phase of the GABA response (control response shown as thin trace) but has little effect on the steady-state GABA response. C and D, responses to PS (C) and pictroxinin (D) application during the steady-state phase of the response to 500 μm GABA. GABA was pre-applied for 20 s before antagonist application. Note the inhibition of the steady-state GABA response by PS and complicated development of block followed by redevelopment of current during picrotoxinin application. Dotted lines indicate holding current level in the absence of GABA.
Figure 9
Figure 9. Simulations of PS effects
A, kinetic scheme. PS was allowed to bind singly and doubly liganded open and closed states. Following PS binding, entry into the D2 desensitized state (D2P) was speeded by 6-fold (*). The PS association rate constant was 1 μm−1 s−1, and the PS dissociation rate was 5 s−1. Faster rate constants produced fast kinetics and current relaxations that were not experimentally observed. The PS association rate constant is much slower than diffusion-limited rates, but is similar to the rate constant predicted from single-channel measurements (Akk et al. 2001). Other kinetic parameters were the same as previously reported (Mozrzymas et al. 1999; Shen et al. 2000). B, simulation of response to pulse application of 20 μm GABA in the absence and presence of PS for 10 s, beginning 6 s following the onset of the simulation. The thick line is the response to GABA alone. The thin line is the response to GABA plus 5 μm PS. C, magnified view of the deactivation phase of the responses shown in B. The PS deactivation trace has been scaled to the amplitude of the control deactivation trace. Note the slower deactivation of the current in the presence of PS. D, response to increasing PS concentrations applied during the steady-state phase of the response to 20 μm GABA. Responses to 5, 10, and 1000 μm PS (bottom, middle and top traces, respectively) are shown. The period of PS application is denoted by the horizontal bar. Note that the inhibition saturates at less than 100 % block. Peak GABA responses have been truncated to highlight effects on steady-state responses. E, degree of inhibition by 5 μm PS in response to 1 mm full agonist application (GABA) or 1 mm partial agonist (P4S). Partial agonist currents were simulated by slowing channel opening rates by 5—fold. Resulting simulated steady-state currents were approximately 3-fold smaller in response to the partial agonist. Note the simulations predict more inhibition of P4S-gated current than GABA-gated current, contrary to experimental observations. FJ, PS inhibition simulated by PS binding and inhibition of the doubly liganded open state of the receptor. Rate constants of PS binding and dissociation were 1 μm−1 s−1 and 0.5 s−1.

Similar articles

Cited by

References

    1. Adams PR. Drug blockade of open end-plate channels. J Physiol. 1976;260:531–552. - PMC - PubMed
    1. Akk G, Bracamontes J, Steinbach JH. Pregnenolone sulfate block of GABAA receptors: mechanism and involvement of a residue in the M2 region of the α subunit. J Physiol. 2001;532:673–684. - PMC - PubMed
    1. Baulieu EE, Robel P. Neurosteroids: a new brain function. J Steroid Biochem Mol Biol. 1990;37:395–403. - PubMed
    1. Bekkers JM, Stevens CF. Excitatory and inhibitory autaptic currents in isolated hippocampal neurons maintained in cell culture. Proc Natl Acad Sci U S A. 1991;88:7834–7838. - PMC - PubMed
    1. Christie SB, De Blas AL. α5 Subunit-containing GABAA receptors form clusters at GABAergic synapses in hippocampal cultures. Neuroreport. 2002;13:2355–2358. - PubMed

Publication types

MeSH terms

LinkOut - more resources