. 2003 Sep 1;198(5):737-46.
doi: 10.1084/jem.20030686. Epub 2003 Aug 25.

Continuous activation of autoreactive CD4+ CD25+ regulatory T cells in the steady state

Affiliations

Continuous activation of autoreactive CD4+ CD25+ regulatory T cells in the steady state

Sylvain Fisson et al. J Exp Med. .

Abstract

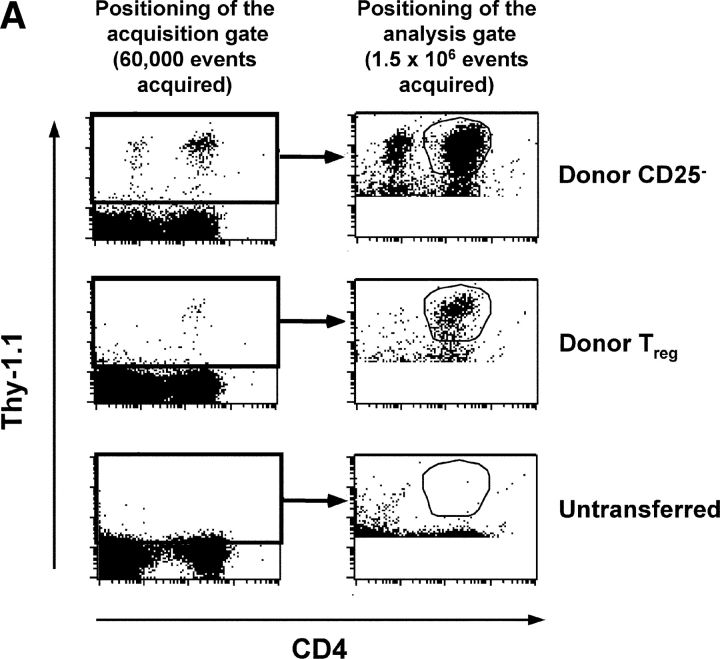
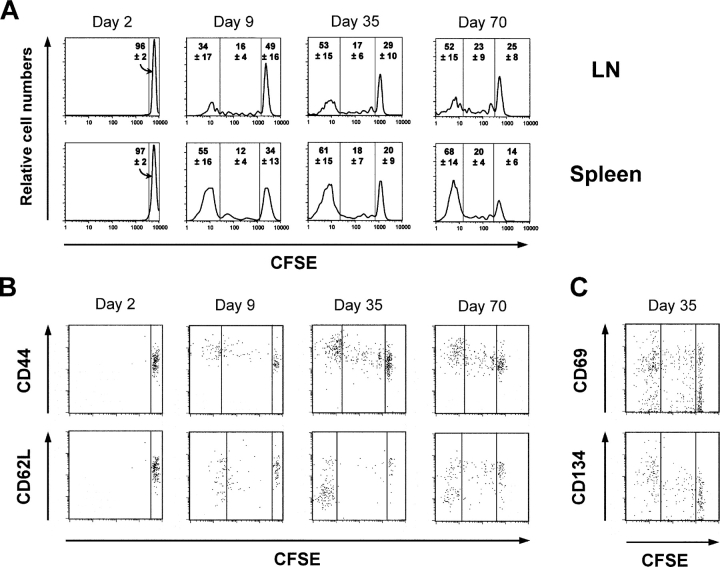
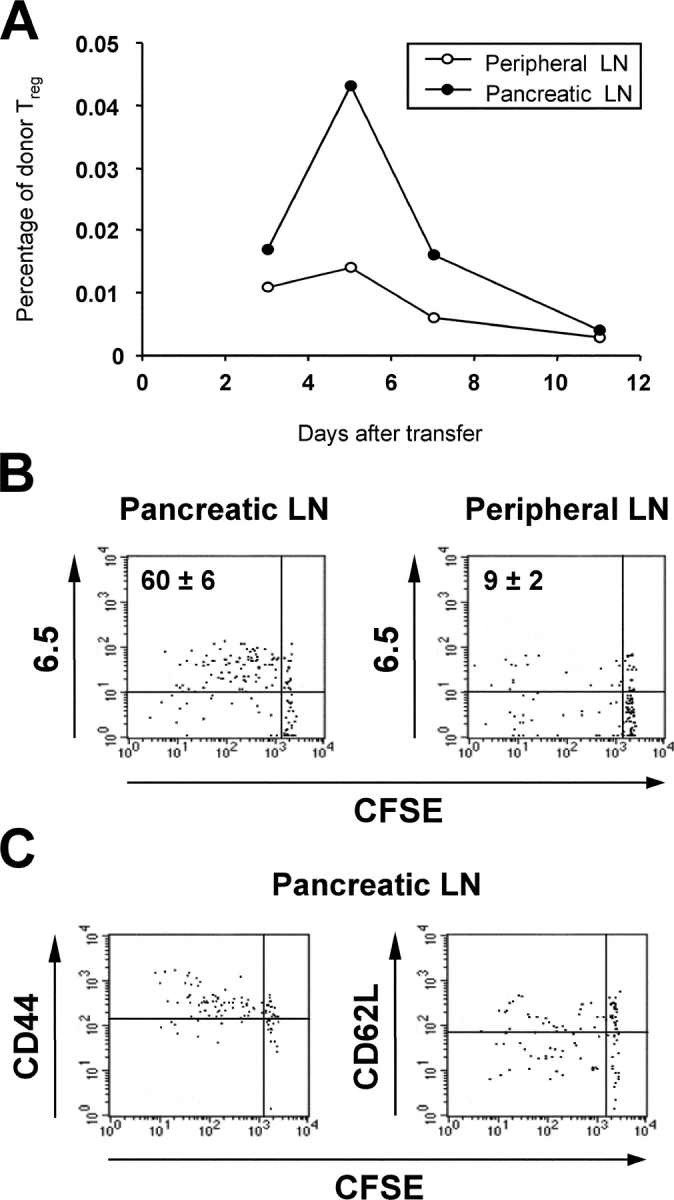
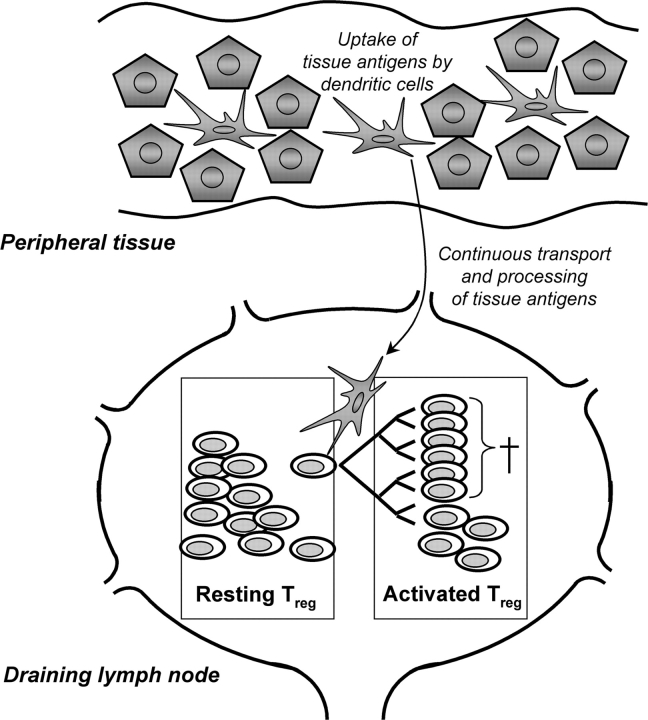
Despite a growing interest in CD4+ CD25+ regulatory T cells (Treg) that play a major role in self-tolerance and immunoregulation, fundamental parameters of the biology and homeostasis of these cells are poorly known. Here, we show that this population is composed of two Treg subsets that have distinct phenotypes and homeostasis in normal unmanipulated mice. In the steady state, some Treg remain quiescent and have a long lifespan, in the order of months, whereas the other Treg are dividing extensively and express multiple activation markers. After adoptive transfer, tissue-specific Treg rapidly divide and expand preferentially in lymph nodes draining their target self-antigens. These results reveal the existence of a cycling Treg subset composed of autoreactive Treg that are continuously activated by tissue self-antigens.


Figures

Figure 1.
Figure 1.
Long-term survival and stable CD25 expression of Treg after adoptive transfer. CD62Lhigh Treg or CD25 cells purified from Thy-1.1 BALB/c mice were injected intravenously into 8–10-wk-old Thy-1.2 congenic BALB/c mice and analyzed by flow cytometry 2, 9, 35, and 70 d after transfer. (A) Reliable identification of very low percentages of donor CD4+ Thy-1.1+ cells in recipient mice is possible after acquisition of 1–2 million cells by flow cytometry. Left panels show dot plots on whole LN cells after acquisition of 60,000 events and right panels show dot plots after acquisition of 1.5 × 10⁶ events (only Thy1–1+ cells were saved to limit sizes of the files). Representative dot plots of mice injected with CD25 cells or CD62Lhigh Treg, as well as a dot plot of control noninjected mice, are shown. Noninjected mice were systemically included in these analyses to quantify background level. Depending on the transfer experiment and time point, the number of events in the CD4+ Thy-1.1+ gate was between 0 to 8 for noninjected mice versus 150 to 1,150 in mice injected with Treg in the spleen or LN. (B) Quantification of donor CD4+ Thy-1.1+ cells in the spleen (• and ▪) and LNs (○ and □) is expressed in percentage (top) and total number (bottom) of CD4+ Thy-1.1+ cells per organ for one representative experiment out of four independent experiments. Each symbol represents one individual mouse. (C) The graph represents the relative average number of indicated donor cells from four independent experiments (total of 5–12 mice per time point). For each experiment, the mean number of donor cells at different time points were divided by the mean number of donor cells at day 2, giving relative mean values. The average of these mean values from the four experiments was represented in arbitrary units, the one at day 2 is by definition of 1. Error bars represent the SD. The increased proportion of CD25 T cells between days 2 and 9 was not statistically significant. (D) 2, 9, 35, and 70 d after transfer of CD62Lhigh Treg, donor cells were analyzed for expression of CD4 and CD25 in LNs. Each dot plot, gated on Thy-1.1+, is representative of five to eight mice per time point from four independent experiments. Values indicate the mean percentage ± SD of CD25+ cells among CD4+ cells.
Figure 1.
Figure 1.
Long-term survival and stable CD25 expression of Treg after adoptive transfer. CD62Lhigh Treg or CD25 cells purified from Thy-1.1 BALB/c mice were injected intravenously into 8–10-wk-old Thy-1.2 congenic BALB/c mice and analyzed by flow cytometry 2, 9, 35, and 70 d after transfer. (A) Reliable identification of very low percentages of donor CD4+ Thy-1.1+ cells in recipient mice is possible after acquisition of 1–2 million cells by flow cytometry. Left panels show dot plots on whole LN cells after acquisition of 60,000 events and right panels show dot plots after acquisition of 1.5 × 10⁶ events (only Thy1–1+ cells were saved to limit sizes of the files). Representative dot plots of mice injected with CD25 cells or CD62Lhigh Treg, as well as a dot plot of control noninjected mice, are shown. Noninjected mice were systemically included in these analyses to quantify background level. Depending on the transfer experiment and time point, the number of events in the CD4+ Thy-1.1+ gate was between 0 to 8 for noninjected mice versus 150 to 1,150 in mice injected with Treg in the spleen or LN. (B) Quantification of donor CD4+ Thy-1.1+ cells in the spleen (• and ▪) and LNs (○ and □) is expressed in percentage (top) and total number (bottom) of CD4+ Thy-1.1+ cells per organ for one representative experiment out of four independent experiments. Each symbol represents one individual mouse. (C) The graph represents the relative average number of indicated donor cells from four independent experiments (total of 5–12 mice per time point). For each experiment, the mean number of donor cells at different time points were divided by the mean number of donor cells at day 2, giving relative mean values. The average of these mean values from the four experiments was represented in arbitrary units, the one at day 2 is by definition of 1. Error bars represent the SD. The increased proportion of CD25 T cells between days 2 and 9 was not statistically significant. (D) 2, 9, 35, and 70 d after transfer of CD62Lhigh Treg, donor cells were analyzed for expression of CD4 and CD25 in LNs. Each dot plot, gated on Thy-1.1+, is representative of five to eight mice per time point from four independent experiments. Values indicate the mean percentage ± SD of CD25+ cells among CD4+ cells.
Figure 2.
Figure 2.
Rapid turnover and acquired activated phenotype of a Treg subset. 2, 9, 35, and 70 d after transfer of CFSE-labeled Thy-1.1 CD62Lhigh Treg into Thy-1.2 BALB/c mice, donor cells (gated on CD4+ Thy1.1+ cells) were analyzed for cell division (A) and activation markers (B and C). The vertical bars delimit undivided cells from cells that had divided one to six times and cells that went through more than six divisions. (A) Each CFSE histogram is representative of four to six mice per time point. Values indicate the mean percentage ± SD of cells in the different quadrants. (B and C) Each dot plot is representative of four to six mice per time point.
Figure 3.
Figure 3.
Analysis of turnover of Treg by BrdU incorporation. BALB/c mice were treated with BrdU administered continuously for 7 d using osmotic pumps. Then, peripheral LN cells and splenocytes were analyzed for cell surface expression of CD4, CD25, and CD44, and BrdU incorporated into DNA of divided cells. Levels of BrdU incorporations were quantified on gated CD4+ CD25+ CD44high cells and CD4+ CD25+ CD44low cells in LNs and the spleen as defined in A. Background BrdU staining levels were obtained from untreated mice (B). Representative results are shown and values indicate the mean ± SD of BrdU+ cells from data from two independent experiments (seven mice). The percentage of CD25+ CD4+ T cells was not statistically different in mice receiving osmotic pump with BrdU, mice receiving osmotic pump with PBS, and unmanipulated mice. In A, CD25+ CD4+ T cells represented 8.2% of CD4+ cells.
Figure 4.
Figure 4.
Cell surface phenotype reveals two Treg subsets. Peripheral LN cells of BALB/c adult mice were analyzed for cell surface expression of CD4, CD25, CD62L, and the indicated markers. Gated on CD4+ CD25+ cells, expression of the indicated markers was plotted with CD62L expression. The arrowheads on the left and right sides of the dot plots indicate the mean fluorescence intensity obtained with isotypic control mAb for the CD62Lhigh and CD62Llow Treg populations delineated by the dashed vertical line. Each dot plot is representative of three independent experiments (six mice).
Figure 5.
Figure 5.
The activated Treg population contains autoreactive cells. CFSE-labeled CD62Lhigh Treg purified from Thy-1.1 TCR-HA transgenic mice were intravenously injected into Thy-1.2 ins-HA transgenic mice. (A) The proportion of CD4+ Thy-1.1+ donor cells was determined by flow cytometry in pancreatic (•) and peripheral (○) LNs 3, 5, 7, and 11 d after transfer. The graph, which represents the percentage of donor Treg (CD4+ Thy-1.1+) per organ, shows the mean of two to three mice per time point and is representative of three independent experiments. (B and C) Representative phenotypic analysis of the donor cells on day 7 after transfer in the indicated LNs. Gated on CD4+ Thy-1.1+ cells, cells were analyzed for CFSE staining and expression of the anti-HA–specific TCR using the 6.5 mAb or of CD44 and CD62L. Values ± SD indicate the percentages of 6.5+ divided cells.
Figure 6.
Figure 6.
A model describing some of the features of the homeostasis of Treg. In the steady state, tissue self-Ag, originated from dying cells, molecule shedding, or direct capture from live cells, are presented by Ag-presenting cells in draining LNs. This presentation of self-Ag induces activation of specific autoreactive cells derived from the pool of long-life resting Treg. During rapid expansion, the cells enter the pool of activated Treg, displaying an activated phenotype. Then, some of them die or recirculate in the spleen.

References

    1. Sakaguchi, S., N. Sakaguchi, J. Shimizu, S. Yamazaki, T. Sakihama, M. Itoh, Y. Kuniyasu, T. Nomura, M. Toda, and T. Takahashi. 2001. Immunologic tolerance maintained by CD25+ CD4+ regulatory T cells: their common role in controlling autoimmunity, tumor immunity, and transplantation tolerance. Immunol. Rev. 182:18–32. - PubMed
    1. Shevach, E.M. 2002. CD4+ CD25+ suppressor T cells: more questions than answers. Nat. Rev. Immunol. 2:389–400. - PubMed
    1. Murakami, M., A. Sakamoto, J. Bender, J. Kappler, and P. Marrack. 2002. CD25+ CD4+ T cells contribute to the control of memory CD8+ T cells. Proc. Natl. Acad. Sci. USA. 99:8832–8837. - PMC - PubMed
    1. Annacker, O., R. Pimenta-Araujo, O. Burlen-Defranoux, T.C. Barbosa, A. Cumano, and A. Bandeira. 2001. CD25+ CD4+ T cells regulate the expansion of peripheral CD4 T cells through the production of IL-10. J. Immunol. 166:3008–3018. - PubMed
    1. Belkaid, Y., C.A. Piccirillo, S. Mendez, E.M. Shevach, and D.L. Sacks. 2002. CD4+ CD25+ regulatory T cells control Leishmania major persistence and immunity. Nature. 420:502–507. - PubMed

Publication types

MeSH terms

Substances