Comparative Study
. 2003 Sep 1;22(17):4489-500.
doi: 10.1093/emboj/cdg437.

HS5 of the human beta-globin locus control region: a developmental stage-specific border in erythroid cells

Affiliations
Comparative Study

HS5 of the human beta-globin locus control region: a developmental stage-specific border in erythroid cells

Albert W K Wai et al. EMBO J. .

Abstract

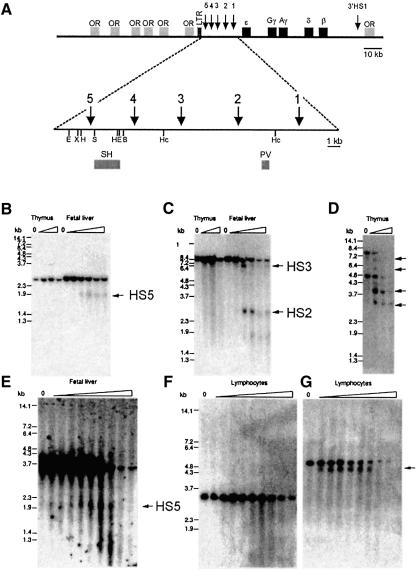
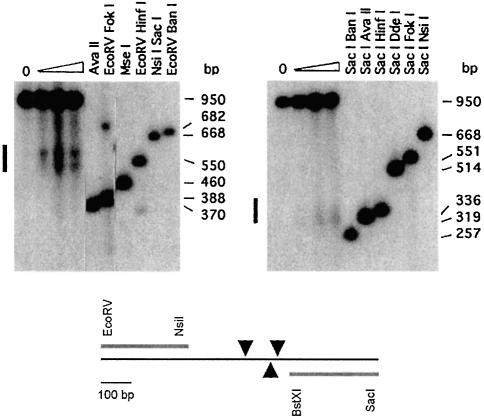
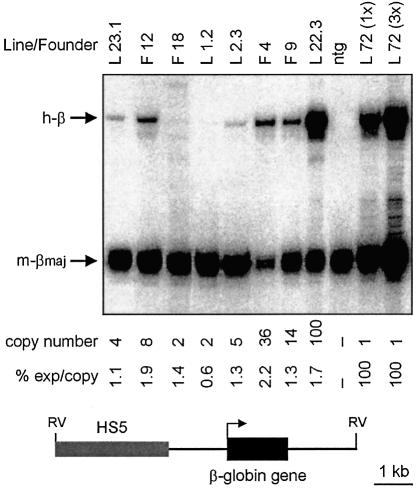
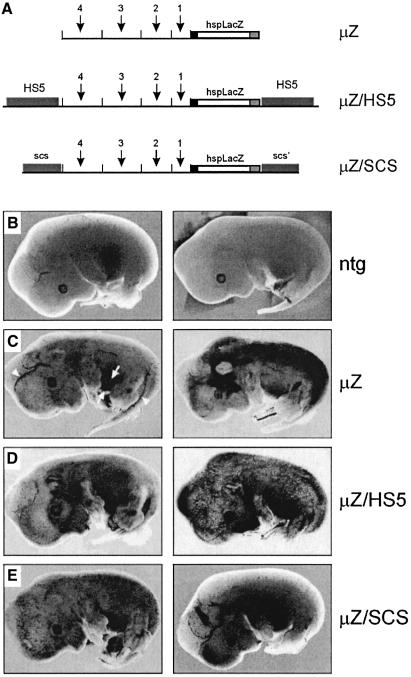
Elements with insulator/border activity have been characterized most extensively in Drosophila melanogaster. In vertebrates, the first example of such an element was provided by a hypersensitive site of the chicken beta-globin locus, cHS4. It has been proposed that the homologous site in humans, HS5, functions as a border of the human beta-globin locus. Here, we have characterized HS5 of the human beta-globin locus control region. We have examined its tissue-specificity and assessed its insulating properties in transgenic mice using a lacZ reporter assay. Most importantly, we have tested its enhancer blocking activity in the context of the full beta-globin locus. Our results show that HS5 is erythroid-specific rather than ubiquitous in human tissues. Furthermore, HS5 does not fulfil the criteria of a general in vivo insulator in the transgene protection assay. Finally, a HS5 conditional deletion from the complete locus demonstrates that HS5 has no discernable activity in adult erythroid cells. Surprisingly, HS5 functions as an enhancer blocker in embryonic erythroid cells. We conclude that HS5 is a developmental stage-specific border in erythroid cells.


Figures

None
Fig. 1. HS5 of the human β-globin locus is erythroid-specific. (A) The top line shows the human β-globin locus. The five globin genes and the LTR element are indicated. Arrows show hypersensitive sites. E, EcoRI; X, XbaI; H, HindIII; B, BamHI; Hc, HincII; S, SacI. Probes used: PV, 450 bp PvuII–EcoR fragment and SH, 1.3 kb SacI–HindIII fragment. (BG) In vivo DNase I hypersensitive site mapping. Nuclei were prepared from E13.5 fetal livers and young animals (thymus) of the β-locus line 72 (B, C, D); human fetal liver at 16 weeks of gestation (E) and adult peripheral blood (F and G), and digested with increasing amounts of DNase I. DNA was digested with HindIII (B), HincII (C), BglII (D), BamHI–EcoRI (E) and BamHI–XbaI (F and G), Southern blotted and probed with SH (B, E, F) and PV (C). The wedge above each panel indicates increasing amounts of DNase I. ‘0’ indicates no DNase I. Arrows indicate DNase I hypersensitive sites. As a control for hypersensitivity, the thymus DNase I series in (B and C) were used in (D) and probed with a 950 bp NcoI fragment of the murine vav gene. A duplicate filter of (F) was used in (G) and probed with a 600 bp SacI–HindIII fragment of the human CD2 gene to detect the 3′ hypersensitive site.
None
Fig. 2. DNase I fine mapping of HS5 in vivo. Nuclei from MEL cells with three copies of a cosmid containing the human β-globin LCR and ε-globin gene were digested with increasing amounts of DNase I. DNA was purified, cut with SacI and EcoRV, and Southern blotted. Internal molecular weight markers were obtained by cutting DNA from the ‘no DNase I’ sample (0) with the restriction enzymes indicated. Probes used are a 271 bp EcoRV–NsiI fragment (5′ probe; left panel) and a 300 bp BstXI–SacI fragment (3′ probe, right panel). The location of major DNase I cleavage sites (arrowheads) and the positions of the probes is shown below.
None
Fig. 3. Activity of HS5 in erythroid cells. Fetal liver RNA was isolated from E13.5 fetuses carrying the HS5–β-globin transgene (bottom line). Expression of the human β-globin transgene was analyzed by quantitative S1 nuclease analysis. Expression was calculated as (human β-globin signal/transgene copy number)/(mouse β-major signal/2) and was set at 100% for line 72. F, founder; L, line; ntg, non-transgenic; 72 (1×), line 72 E13.5 fetal liver RNA; 72 (3×), 3 × the amount of line 72 E13.5 fetal liver RNA to demonstrate probe excess.
None
Fig. 4. Position effect assay in transgenic mice. (A) Constructs µZ, µZ/HS5 and µZ/SCS contain the bacterial β-galactosidase gene driven by a 100 bp hsp68 promoter fragment (hspLacZ). The arrows and numbers indicate the individual hypersensitive sites in the µLCR construct. (BE) Examples of transgenic fetuses (E13.5) stained for β-galactosidase activity. The transgene is indicated on the right; two different fetuses are shown for each construct.. Ntg, non-transgenic control fetuses. Erythroid tissues at this stage of development are indicated in panel C: the fetal liver (the site of erythropoiesis at the fetal stage) is in between two arrows; arrowheads point to the major vasculature containing blue-stained circulating erythrocytes. The presence of these cells in capillaries results in the blue-spotted appearance of the fetus.
None
Fig. 5. Constructs for the generation of mutant β-globin PAC transgenic mice. (A) PAC1: HS5 is flanked by a βm gene, a loxP site (triangle) inserted upstream, and loxP (triangle)/FRT (open rectangle) sites inserted downstream of HS5. PAC2: same as PAC1 except the βm gene and 5′ loxP site are moved upstream to the LTR element. PAC3: same as PAC1 except with a deleted β gene promoter (ΔPr). (B) Probes used to characterize the PAC1, -2 and -3 plasmids, and transgenic mice. Map is not drawn to scale.
None
Fig. 6. Expression analysis of the human β-globin PAC transgenes in adult transgenic mice. (A) Quantitative S1 protection assay was performed in adult blood samples to study the changes in level of βm- and β expression in the PAC1 (A and B); PAC2 (M and N) and PAC3 (G and K) lines before and after HS5 deletion (PACΔ1, PACΔ3), or 5′ LTR+HS5 deletion (PACΔ2). Control samples are from a wild-type β-globin PAC transgenic line (6.1); and a non-transgenic mouse (ntg). Arrows indicate the positions of protected fragments for mouse α-globin (m-α), mouse β-major globin (m-βmaj), human β-globin (h-β) and human βm globin (h-βm). (B) Quantitation of the expression of the βm- and β genes in adult transgenic mice. The bar graphs depict the levels of βm and β expression, relative to mouse α-globin expression and after correction for the specific activities of the S1 probes. Black bars: PAC1, -2 and -3; grey bars: PACΔ1, Δ2 and Δ3; white bars: control PAC, after correction for expression per copy.
None
Fig. 7. Expression analysis of the human β-globin PAC transgenes in transgenic mouse embryos. (A) Quantitative S1 protection assay carried out on E10.5d.p.c. yolk sac samples of PAC1 (A and B); PAC2 (M and N) and PAC3 (G, H, K) lines before and after HS5 deletion (PACΔ1, PACΔ3), or 5′ LTR+HS5 deletion (PACΔ2), to determine the expression levels of βm- and γ-globin. A longer exposure of the lower part of the gel is shown at the bottom. (B) Quantitation of the expression of the βm- and γ-globin genes in transgenic mouse embryos. The bar graphs depict the levels of βm and γ-globin expression, relative to mouse α-globin expression and after correction for the specific activities of the S1 probes. See legend to Figure 6 for other details; the arrow with h-γ indicates the position of the protected fragment for γ-globin. The scale on the y-axis is changed in the top panel, to accommodate for the relatively low expression levels of the βm gene.

Similar articles

Cited by

References

    1. Antoniou M. (1991) Induction of erythroid-specific expression in murine erythroleukemia (MEL) cell lines. Methods Mol. Biol., 7, 421–434. - PubMed
    1. Bender M.A., Bulger,M., Close,J. and Groudine,M. (2000) β-globin gene switching and DNase I sensitivity of the endogenous β-globin locus in mice do not require the locus control region. Mol. Cell, 5, 387–393. - PubMed
    1. Bungert J., Tanimoto,K., Patel,S., Liu,Q., Fear,M. and Engel,J.D. (1999) Hypersensitive site 2 specifies a unique function within the human β-globin locus control region to stimulate globin gene transcription. Mol. Cell. Biol., 19, 3062–3072. - PMC - PubMed
    1. Burgess-Beusse B., Farrell,C., Gaszner,M., Litt,M., Mutskov,V., Recillas-Targa,F., Simpson,M., West,A. and Felsenfeld,G. (2002) The insulation of genes from external enhancers and silencing chromatin. Proc. Natl Acad. Sci. USA, 99, 16433–16437. - PMC - PubMed
    1. Carter D., Chakalova,L., Osborne,C.S., Dai,Y.F. and Fraser,P. (2002) Long-range chromatin regulatory interactions in vivo. Nat. Genet., 32, 623–626. - PubMed

Publication types