

H2A.Z has a function reminiscent of an activator required for preferential binding to intergenic DNA
- PMID: 12941702
- PMCID: PMC202369
- DOI: 10.1093/emboj/cdg427
H2A.Z has a function reminiscent of an activator required for preferential binding to intergenic DNA
Abstract
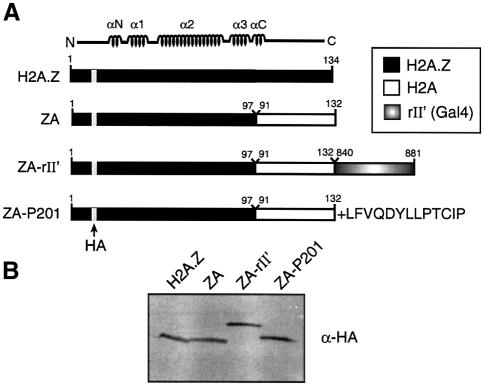
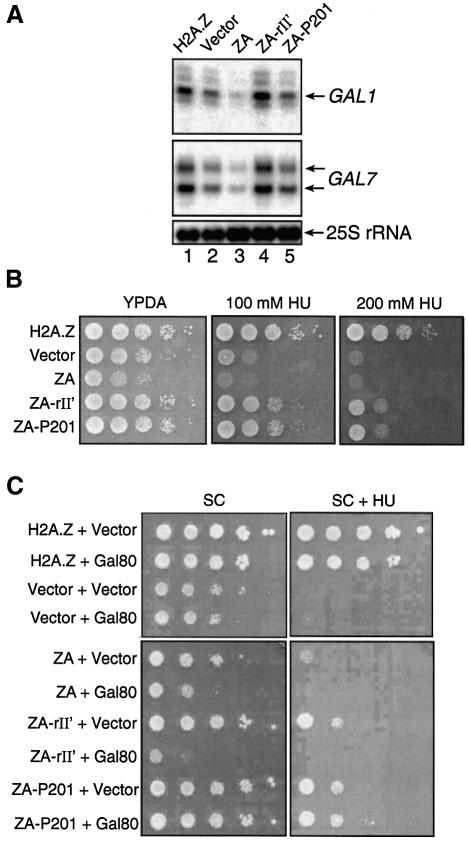
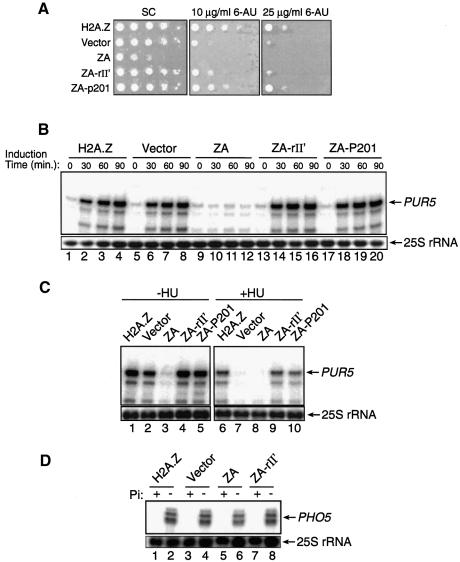
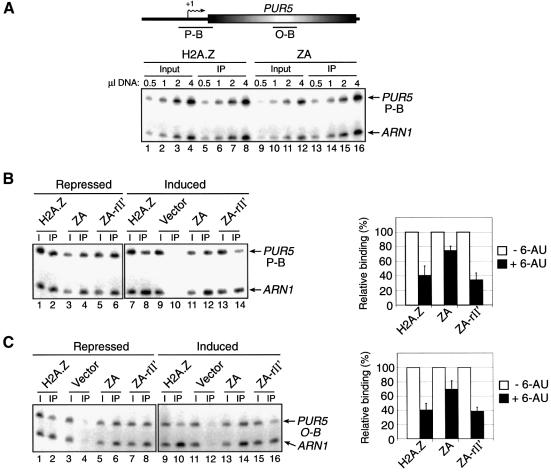
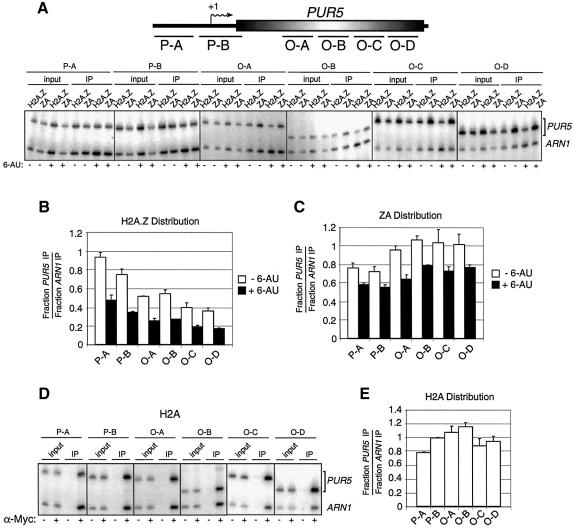
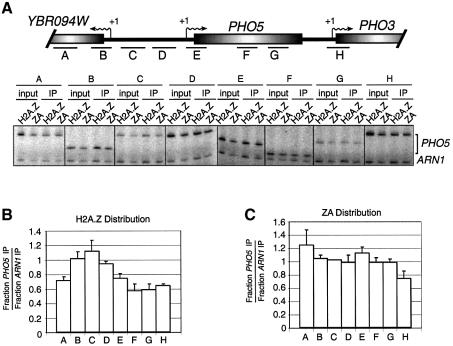
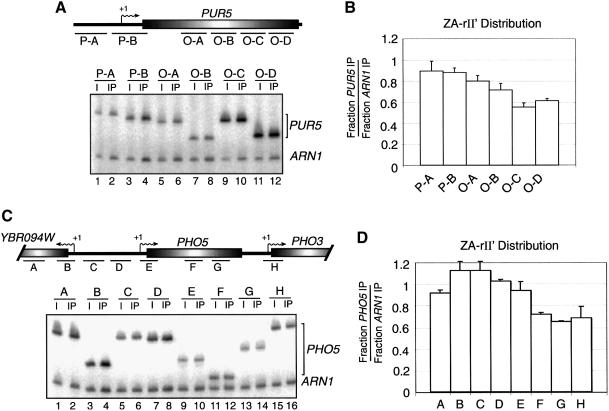
H2A.Z has been shown to regulate transcription in yeast, and that function resides in its C-terminal region as the reciprocal portion of H2A cannot substitute for the latter. We show that fusion of a transcriptional activating region to the C-terminal region of H2A, which is substituted for that of H2A.Z, can allow the chimera to fulfil the special role of H2A.Z in positive gene regulation, as well as complement growth deficiencies of htz1delta cells. We further show that the 'transcription' function of H2A.Z is linked to its ability to preferentially localize to certain intergenic DNA regions. Our results suggest that H2A.Z modulates functional interactions with transcription regulatory components, and thus increases its localization to promoters where it helps poise chromatin for gene activation.
Figures
Similar articles
-
Histone variant H2A.Z marks the 5' ends of both active and inactive genes in euchromatin.Cell. 2005 Oct 21;123(2):233-48. doi: 10.1016/j.cell.2005.10.002. Cell. 2005. PMID: 16239142 Free PMC article.
-
Variant histone H2A.Z, but not the HMG proteins Nhp6a/b, is essential for the recruitment of Swi/Snf, Mediator, and SAGA to the yeast GAL1 UAS(G).Biochem Biophys Res Commun. 2008 May 16;369(4):1103-7. doi: 10.1016/j.bbrc.2008.02.144. Epub 2008 Mar 10. Biochem Biophys Res Commun. 2008. PMID: 18331823
-
Histone H2A.Z regulats transcription and is partially redundant with nucleosome remodeling complexes.Cell. 2000 Oct 27;103(3):411-22. doi: 10.1016/s0092-8674(00)00133-1. Cell. 2000. PMID: 11081628
-
The role of chromatin structure in regulating stress-induced transcription in Saccharomyces cerevisiae.Biochem Cell Biol. 2006 Aug;84(4):477-89. doi: 10.1139/o06-079. Biochem Cell Biol. 2006. PMID: 16936821 Review.
-
DNA methylation, H2A.Z, and the regulation of constitutive expression.Cold Spring Harb Symp Quant Biol. 2012;77:147-54. doi: 10.1101/sqb.2012.77.014944. Epub 2012 Dec 18. Cold Spring Harb Symp Quant Biol. 2012. PMID: 23250988 Review.
Cited by
-
Decoding the epigenetic language of plant development.Mol Plant. 2010 Jul;3(4):719-28. doi: 10.1093/mp/ssq026. Mol Plant. 2010. PMID: 20663898 Free PMC article. Review.
-
p21 transcription is regulated by differential localization of histone H2A.Z.Genes Dev. 2007 Aug 1;21(15):1869-81. doi: 10.1101/gad.1545707. Genes Dev. 2007. PMID: 17671089 Free PMC article.
-
Expression of P. falciparum var genes involves exchange of the histone variant H2A.Z at the promoter.PLoS Pathog. 2011 Feb;7(2):e1001292. doi: 10.1371/journal.ppat.1001292. Epub 2011 Feb 17. PLoS Pathog. 2011. PMID: 21379342 Free PMC article.
-
Expression and functionality of histone H2A variants in cancer.Oncotarget. 2014 Jun 15;5(11):3428-43. doi: 10.18632/oncotarget.2007. Oncotarget. 2014. PMID: 25003966 Free PMC article. Review.
-
Characterizing the regulatory effects of H2A.Z and SWR1-C on gene expression during hydroxyurea exposure in Saccharomyces cerevisiae.PLoS Genet. 2025 Jan 21;21(1):e1011566. doi: 10.1371/journal.pgen.1011566. eCollection 2025 Jan. PLoS Genet. 2025. PMID: 39836664 Free PMC article.
References
-
- Ahmad K. and Henikoff,S. (2002) The histone variant H3.3 marks active chromatin by replication-independent nucleosome assembly. Mol. Cell, 9, 1191–1200. - PubMed
-
- Allen J.B., Zhou,Z., Siede,W., Fried,E.C. and Elledge,S.J. (1994) The SAD1/RAD3 protein kinase controls multiple checkpoints and DNA damage-induced transcription in yeast. Genes Dev., 8, 2416–2428. - PubMed
-
- Barberis A. and Gaudreau,L. (1998) Recruitment of the RNA polymerase II holoenzyme and its implications in gene regulation. Biol. Chem., 379, 1397–1405. - PubMed
-
- Bash R. and Lohr,D. (2001) Yeast chromatin structure and regulation of GAL gene expression. Prog. Nucleic Acid Res. Mol. Biol., 65, 197–259. - PubMed
Publication types
MeSH terms
Substances
LinkOut - more resources
Full Text Sources
Molecular Biology Databases
