

Audio-vocal responses to repetitive pitch-shift stimulation during a sustained vocalization: improvements in methodology for the pitch-shifting technique
- PMID: 12942983
- PMCID: PMC1698961
- DOI: 10.1121/1.1592161
Audio-vocal responses to repetitive pitch-shift stimulation during a sustained vocalization: improvements in methodology for the pitch-shifting technique
Abstract
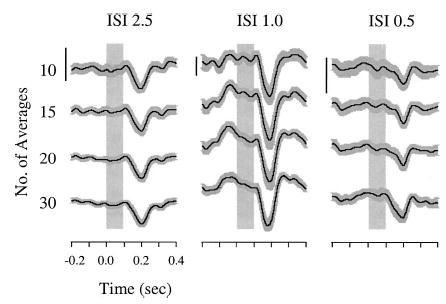
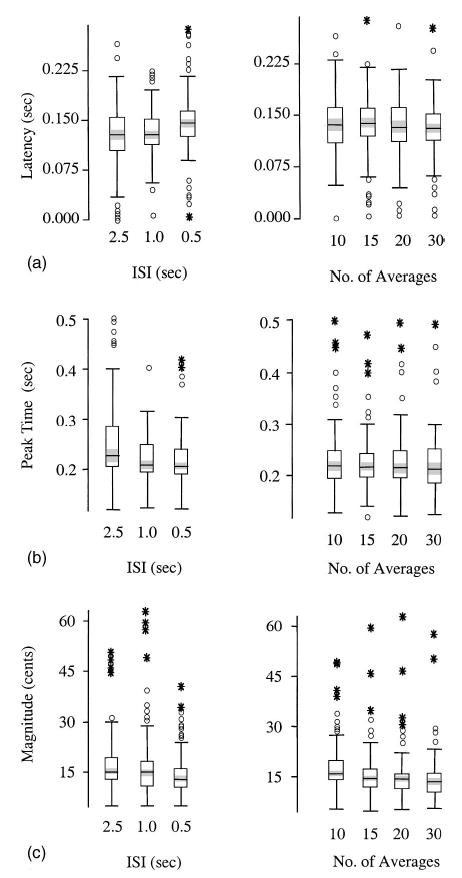
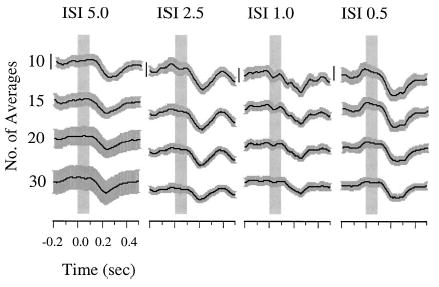
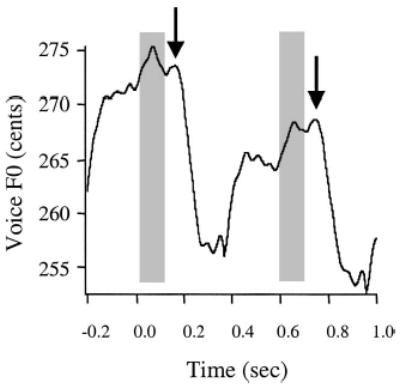
The pitch-shift reflex is a sophisticated system that produces a "compensatory" response in voice F0 that is opposite in direction to a change in voice pitch feedback (pitch-shift stimulus), thus correcting for the discrepancy between the intended voice F0 and the feedback pitch. In order to more fully exploit the pitch-shift reflex as a tool for studying the influence of sensory feedback mechanisms underlying voice control, the optimal characteristics of the pitch-shift stimulus must be understood. The present study was undertaken to assess the effects of altering the duration of the interstimulus interval (ISI) and the number of trials comprising an average on measures of the pitch-shift reflex. Pitch-shift stimuli were presented to vocalizing subjects with ISI of 5.0, 2.5, 1.0, and 0.5 s to determine if an increase in ISI altered response properties. With each ISI, measures of event-related averages of the first 10, 15, 20, or 30 pitch-shift reflex responses were compared to see if increases in the number of responses comprising an event-related average altered response properties. Measures of response latency, peak time, magnitude, and prevalence were obtained for all ISI and average conditions. While quantitative measures were similar across ISI and averaging conditions, we observed more instances of "non-responses" with averages of ten trials as well as at an ISI of 0.5 s. These findings suggest an ISI of 1.0 s and an average consisting of at least 15 trials produce optimal results. Future studies using these stimulus parameters may produce more reliable data due to the fivefold decrease in subject participation time and a concomitant decrease in fatigue, boredom, and inattention.
Figures
References
-
- Abbas PJ, Brown CJ. Electrically evoked auditory brainstem response: Refractory properties and strength-duration functions. Hear Res. 1991;51:139–147. - PubMed
-
- Abbs JH, Gracco VL. Control of complex motor gestures: Orofacial muscle responses to load perturbations of lip during speech. J Neurophysiol. 1984;51:705–723. - PubMed
-
- Barlow SM, Bradford PT. Comparison of perioral reflex modulation in the upper and lower lip. J Speech Hear Res. 1996;39:55–75. - PubMed
-
- Burnett TA, Larson CR. Early pitch shift response is active in both steady and dynamic voice pitch control. J Acoust Soc Am. 2002;112:1058–1063. - PubMed
-
- Burnett TA, Freedland MB, Larson CR, Hain TC. Voice F0 responses to manipulations in pitch feedback. J Acoust Soc Am. 1998;103:3153–3161. - PubMed
Publication types
MeSH terms
Grants and funding
LinkOut - more resources
Full Text Sources