Auditory processing of spectral cues for sound localization in the inferior colliculus
- PMID: 12943370
- PMCID: PMC3202719
- DOI: 10.1007/s10162-002-2002-5
Auditory processing of spectral cues for sound localization in the inferior colliculus
Abstract
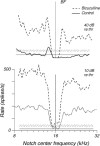
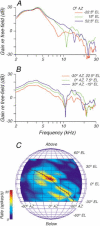
The head-related transfer function (HRTF) of the cat adds directionally dependent energy minima to the amplitude spectrum of complex sounds. These spectral notches are a principal cue for the localization of sound source elevation. Physiological evidence suggests that the dorsal cochlear nucleus (DCN) plays a critical role in the brainstem processing of this directional feature. Type O units in the central nucleus of the inferior colliculus (ICC) are a primary target of ascending DCN projections and, therefore, may represent midbrain specializations for the auditory processing of spectral cues for sound localization. Behavioral studies confirm a loss of sound orientation accuracy when DCN projections to the inferior colliculus are surgically lesioned. This study used simple analogs of HRTF notches to characterize single-unit response patterns in the ICC of decerebrate cats that may contribute to the directional sensitivity of the brain's spectral processing pathways. Manipulations of notch frequency and bandwidth demonstrated frequency-specific excitatory responses that have the capacity to encode HRTF-based cues for sound source location. These response patterns were limited to type O units in the ICC and have not been observed for the projection neurons of the DCN. The unique spectral integration properties of type O units suggest that DCN influences are transformed into a more selective representation of sound source location by a local convergence of wideband excitatory and frequency-tuned inhibitory inputs.
Figures


Similar articles
-
Contralateral effects and binaural interactions in dorsal cochlear nucleus.J Assoc Res Otolaryngol. 2005 Sep;6(3):280-96. doi: 10.1007/s10162-005-0008-5. J Assoc Res Otolaryngol. 2005. PMID: 16075189 Free PMC article.
-
The role of broadband inhibition in the rate representation of spectral cues for sound localization in the inferior colliculus.Hear Res. 2008 Apr;238(1-2):77-93. doi: 10.1016/j.heares.2008.01.008. Epub 2008 Jan 26. Hear Res. 2008. PMID: 18295420 Free PMC article.
-
Limited segregation of different types of sound localization information among classes of units in the inferior colliculus.J Neurosci. 2005 Aug 17;25(33):7575-85. doi: 10.1523/JNEUROSCI.0915-05.2005. J Neurosci. 2005. PMID: 16107645 Free PMC article.
-
Circuits for processing dynamic interaural intensity disparities in the inferior colliculus.Hear Res. 2012 Jun;288(1-2):47-57. doi: 10.1016/j.heares.2012.01.011. Epub 2012 Feb 8. Hear Res. 2012. PMID: 22343068 Free PMC article. Review.
-
Complex sound analysis (frequency resolution, filtering and spectral integration) by single units of the inferior colliculus of the cat.Brain Res. 1988 Apr-Jun;472(2):139-63. doi: 10.1016/0165-0173(88)90018-5. Brain Res. 1988. PMID: 3289688 Review.
Cited by
-
Behavioral and modeling studies of sound localization in cats: effects of stimulus level and duration.J Neurophysiol. 2013 Aug;110(3):607-20. doi: 10.1152/jn.01019.2012. Epub 2013 May 8. J Neurophysiol. 2013. PMID: 23657278 Free PMC article.
-
Identifying neuron types and circuit mechanisms in the auditory midbrain.Hear Res. 2024 Feb;442:108938. doi: 10.1016/j.heares.2023.108938. Epub 2023 Dec 20. Hear Res. 2024. PMID: 38141518 Free PMC article. Review.
-
Segregating two simultaneous sounds in elevation using temporal envelope: Human psychophysics and a physiological model.J Acoust Soc Am. 2015 Jul;138(1):33-43. doi: 10.1121/1.4922224. J Acoust Soc Am. 2015. PMID: 26233004 Free PMC article.
-
The interference of tinnitus on sound localization was related to the type of stimulus.Front Neurosci. 2023 Feb 7;17:1077455. doi: 10.3389/fnins.2023.1077455. eCollection 2023. Front Neurosci. 2023. PMID: 36824213 Free PMC article.
-
Chronic recordings reveal tactile stimuli can suppress spontaneous activity of neurons in somatosensory cortex of awake and anesthetized primates.J Neurophysiol. 2016 Apr;115(4):2105-23. doi: 10.1152/jn.00634.2015. Epub 2016 Feb 24. J Neurophysiol. 2016. PMID: 26912593 Free PMC article.
References
-
- Aitkin LM, Martin RL. The representation of stimulus azimuth by high best-frequency azimuth-selective neurons in the central nucleus of the inferior colliculus of the cat. J. Neurophysiol. 1987;57:1185–1200. - PubMed
-
- Aitkin LM, Webster WR, Veale JL, Crosby DC. Inferior colliculus. I. Comparison of response properties of neurons in central, pericentral, and external nuclei of adult cat. J. Neurophysiol. 1975;38:1195–1207. - PubMed
-
- Batra R, Kuwada S, Fitzpatrick DC. Sensitivity to interaural temporal disparities of low- and high-frequency neurons in the superior olivary complex. I. Heterogeneity of responses. J. Neurophysiol. 1997;78:1222–1236. - PubMed
-
- Cant NB, Casseday JH. Projections from the anteroventral cochlear nucleus to the lateral and medial superior olivary nuclei. J. Comp. Neurol. 1986;247:457–476. - PubMed
Publication types
MeSH terms
Substances
Grants and funding
LinkOut - more resources
Full Text Sources
Miscellaneous

