

Pharmacogenetic heterogeneity of transgene expression in muscle and tumours
- PMID: 12943556
- PMCID: PMC194725
- DOI: 10.1186/1471-2210-3-11
Pharmacogenetic heterogeneity of transgene expression in muscle and tumours
Abstract
Background: Recombinant adenoviruses are employed to deliver a therapeutic transgene in the liver, muscle or tumour tissue. However, to rationalise this delivery approach, the factors of variation between individuals need to be identified. It is assumed that differences between inbred strains of laboratory animals are considered to reflect differences between patients. Previously we showed that transgene expression in the liver of different rat strains was dependent on the transcription efficiency of the transgene. In the present paper we investigated if transfection of muscle and tumour tissue were also subject to such variations.
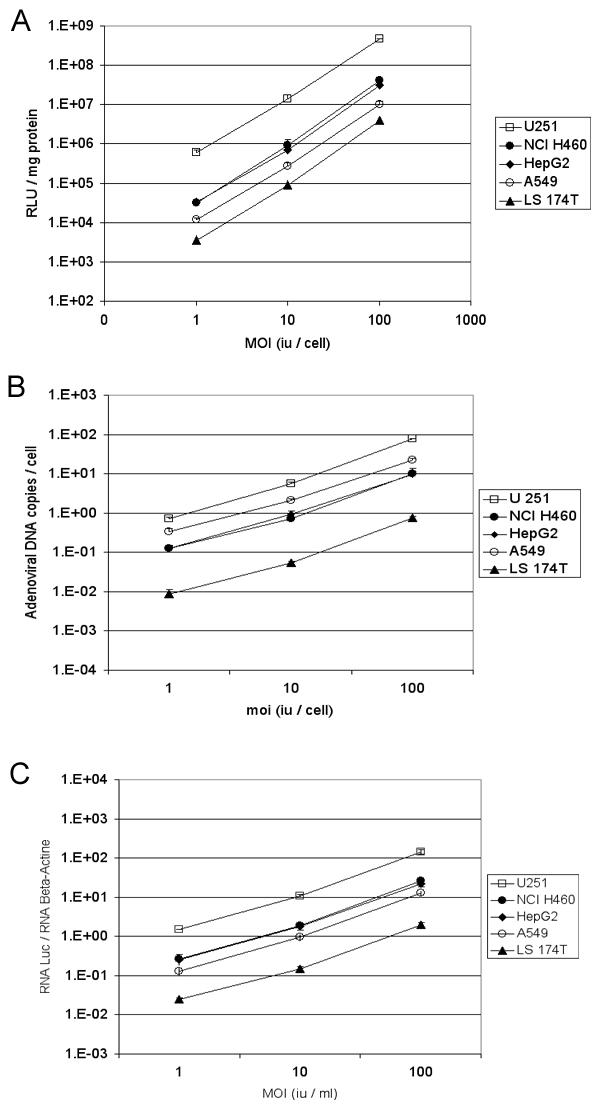
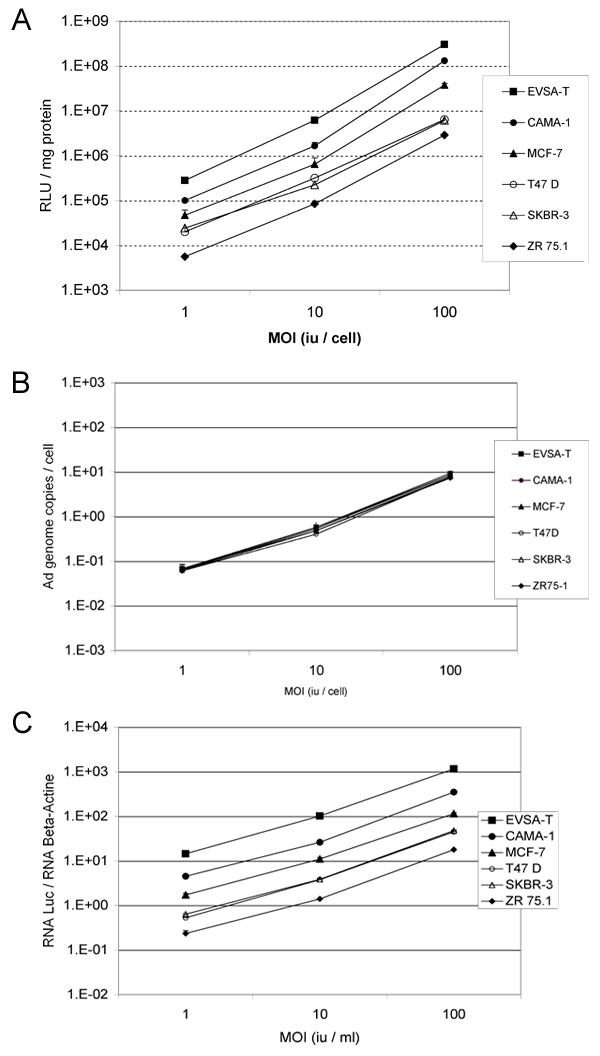
Methods: Variation, in transgene expression, after intramuscular gene delivery was determined in different rodent strains and gene expression in tumours was investigated in different human and rodent cell lines as well as in subcutaneously implanted rodent tumours. The molecular mechanisms involved in transgene expression were dissected using an adenovirus encoding luciferase. The luciferase activity, the viral DNA copies and the luciferase transcripts were assessed in cultured cells as well as in the tissues.
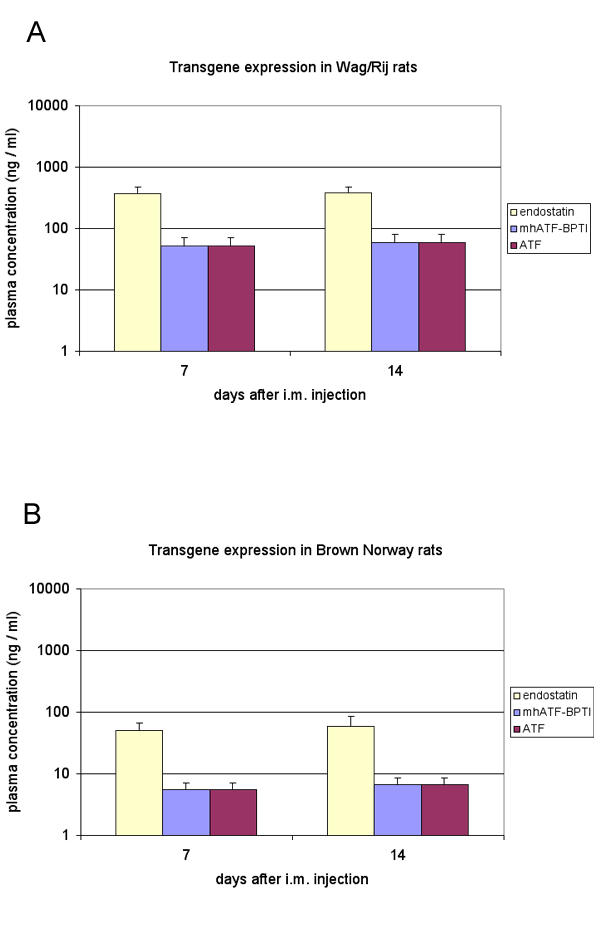
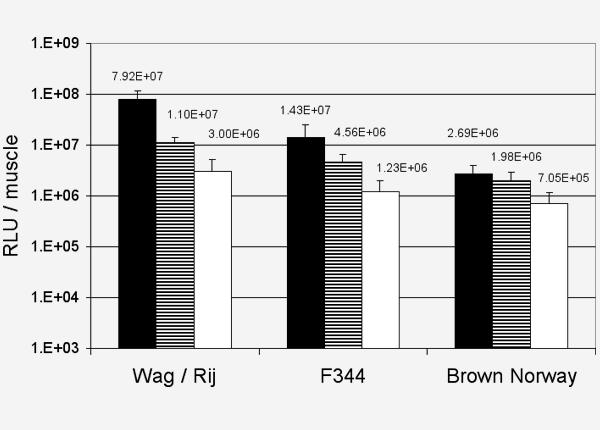
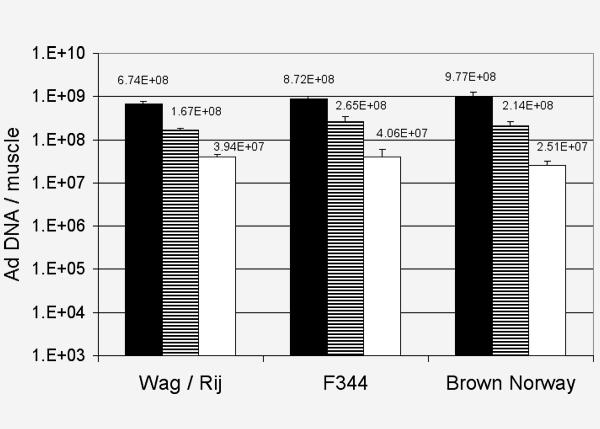
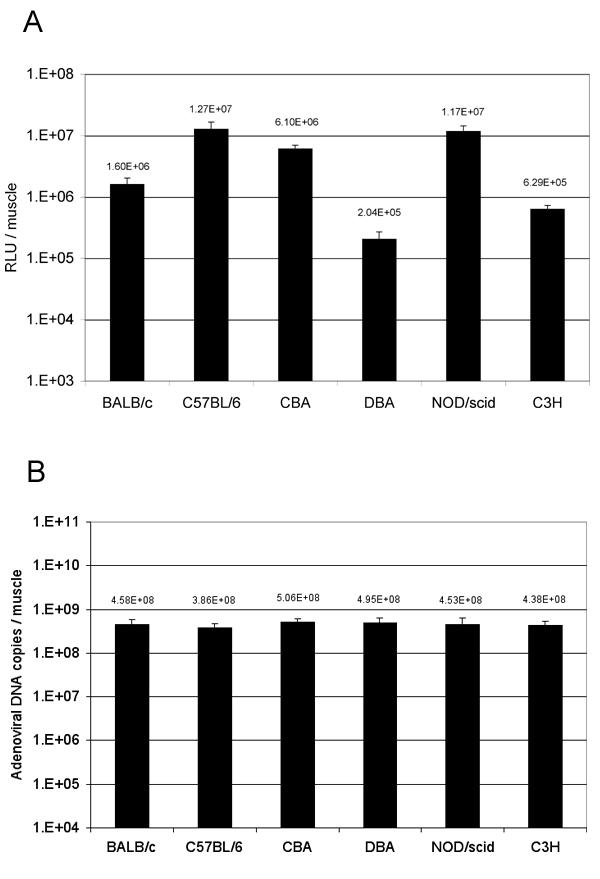
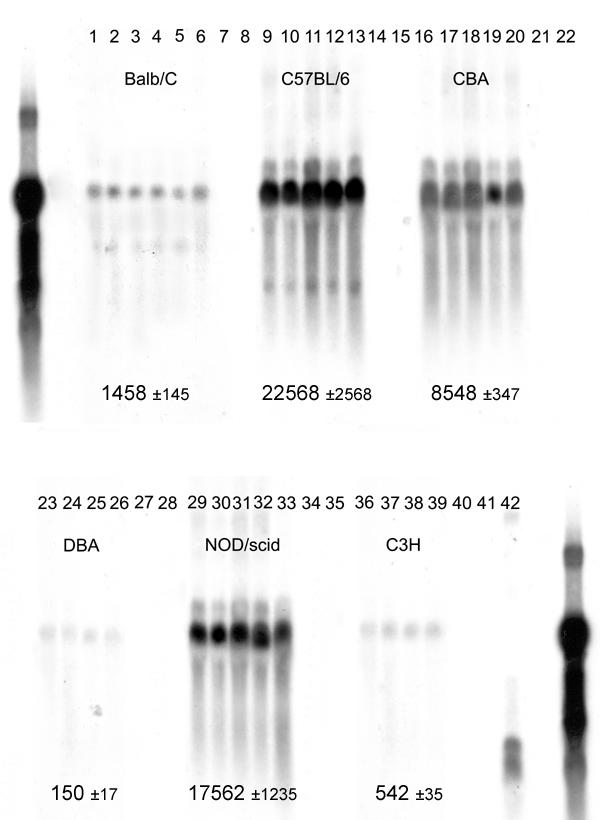
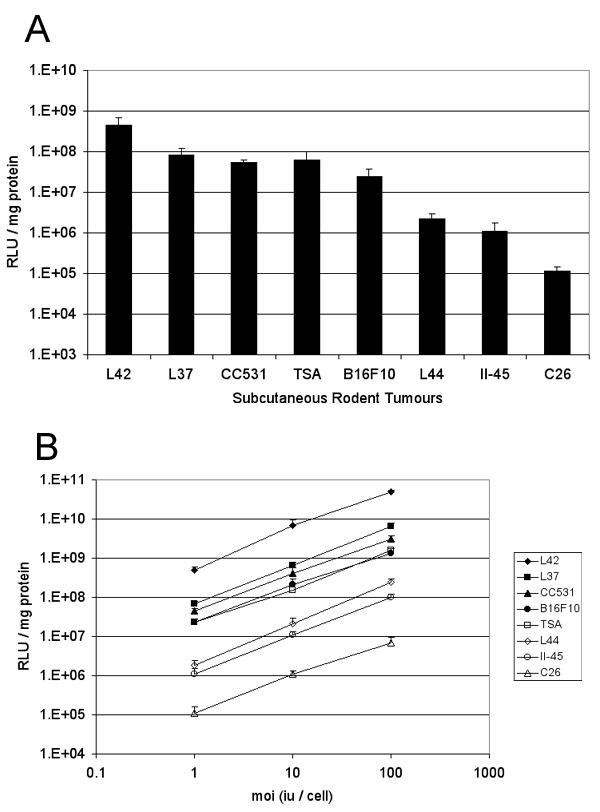
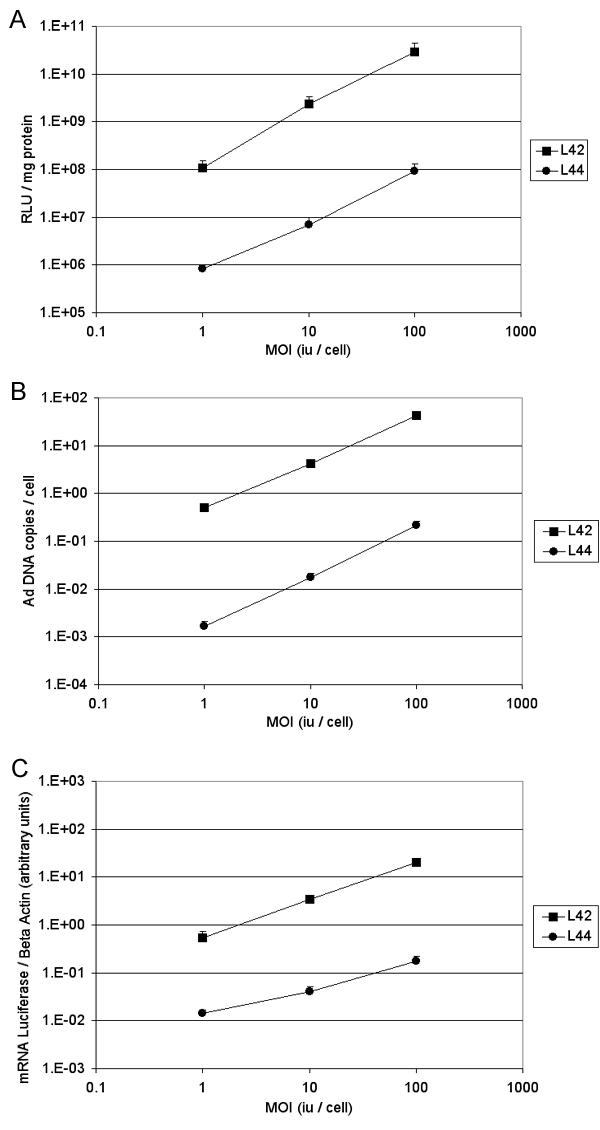
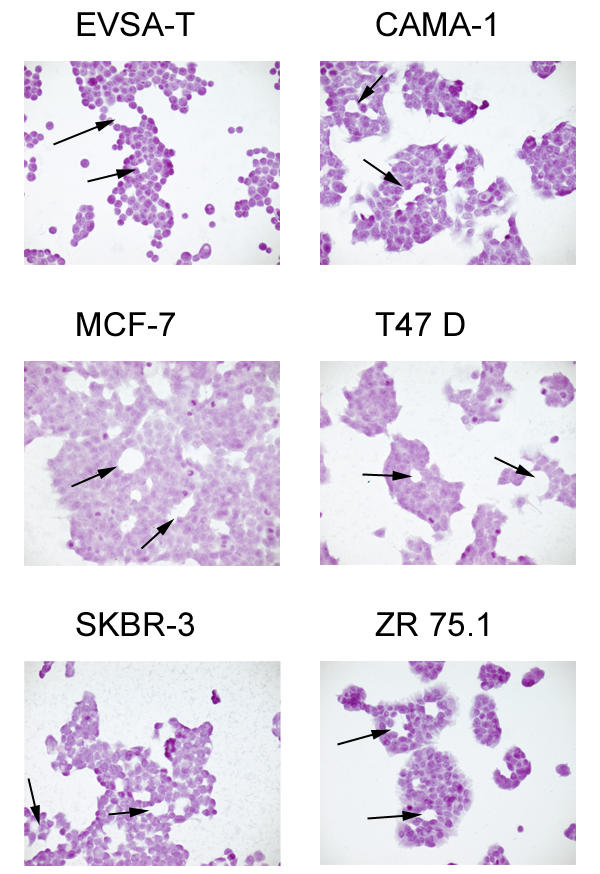
Results: Large differences of luciferase activity, up to 2 logs, were observed between different rodent strains after intramuscular injection of Ad Luciferase. This inter-strain variation of transgene expression was due to a difference in transcription efficiency. The transgene expression level in tumour cell lines of different tissue origin could be explained largely by the difference of infectibility to the adenovirus. In contrast, the main step responsible for luciferase activity variation, between six human breast cancer cell lines with similar phenotype, was at the transcriptional level.
Conclusion: Difference in transcriptional efficiency in muscles as observed between different inbred strains and between human breast cancer cell lines may be expected to occur between individual patients. This might have important consequences for clinical gene therapy. The variation between tumour types and tissues within a species are mainly at the levels of infectivity.
Figures
Similar articles
-
Promoters influence the kinetics of transgene expression following adenovector gene delivery.J Gene Med. 2008 Feb;10(2):123-31. doi: 10.1002/jgm.1127. J Gene Med. 2008. PMID: 18064718
-
Genetic heterogeneity in response to adenovirus gene therapy.BMC Mol Biol. 2003 Apr 5;4:4. doi: 10.1186/1471-2199-4-4. Epub 2003 Apr 5. BMC Mol Biol. 2003. PMID: 12697054 Free PMC article.
-
Cyclophosphamide increases transgene expression mediated by an oncolytic adenovirus in glioma-bearing mice monitored by bioluminescence imaging.Mol Ther. 2006 Dec;14(6):779-88. doi: 10.1016/j.ymthe.2006.08.008. Epub 2006 Sep 22. Mol Ther. 2006. PMID: 16996314 Free PMC article.
-
Viral transgene expression delivered by repeat intraocular adenoviral vector injection: in vivo live imaging study.Mol Imaging. 2012 Sep-Oct;11(5):361-71. Mol Imaging. 2012. PMID: 22954180
-
The Progress of Non-Viral Materials and Methods for Gene Delivery to Skeletal Muscle.Pharmaceutics. 2022 Nov 10;14(11):2428. doi: 10.3390/pharmaceutics14112428. Pharmaceutics. 2022. PMID: 36365246 Free PMC article. Review.
Cited by
-
Imaging of human sodium-iodide symporter gene expression mediated by recombinant adenovirus in skeletal muscle of living rats.Eur J Nucl Med Mol Imaging. 2004 Sep;31(9):1304-11. doi: 10.1007/s00259-004-1570-5. Epub 2004 Jun 25. Eur J Nucl Med Mol Imaging. 2004. PMID: 15221289
-
Sequential administration of bovine and human adenovirus vectors to overcome vector immunity in an immunocompetent mouse model of breast cancer.Virus Res. 2012 Jan;163(1):202-11. doi: 10.1016/j.virusres.2011.09.031. Epub 2011 Sep 29. Virus Res. 2012. PMID: 21971215 Free PMC article.
-
Targeting the oncogene B lymphoma deregulator IgH 3' regulatory region does not impede the in vivo inflammatory response in mice.Oncoscience. 2014 Sep 19;1(9):591-8. doi: 10.18632/oncoscience.81. eCollection 2014. Oncoscience. 2014. PMID: 25594069 Free PMC article.
-
Characterization of neuropathology in the HIV-1 transgenic rat at different ages.J Neuroimmunol. 2016 Mar 15;292:116-25. doi: 10.1016/j.jneuroim.2016.01.022. Epub 2016 Feb 3. J Neuroimmunol. 2016. PMID: 26943969 Free PMC article.
References
-
- Sterman DH, Kaiser LR, Albelda SM. Gene therapy for malignant pleural mesothelioma. Hematol Oncol Clin North Am. 1998;12:553–568. - PubMed
-
- Swisher SG, Roth JA. p53 Gene therapy for lung cancer. Curr Oncol Rep. 2002;4:334–340. - PubMed
-
- Molnar-Kimber KL, Sterman DH, Chang M, Kang EH, ElBash M, Lanuti M, Elshami A, Gelfand K, Wilson JM, Kaiser LR, Albelda SM. Impact of preexisting and induced humoral and cellular immune responses in an adenovirus-based gene therapy phase I clinical trial for localized mesothelioma. Hum Gene Ther. 1998;9:2121–2133. - PubMed
-
- Joseph PM, O'Sullivan BP, Lapey A, Dorkin H, Oren J, Balfour R, Perricone MA, Rosenberg M, Wadsworth SC, Smith AE, St George JA, Meeker DP. Aerosol and lobar administration of a recombinant adenovirus to individuals with cystic fibrosis. I. Methods, safety, and clinical implications. Hum Gene Ther. 2001;12:1369–1382. doi: 10.1089/104303401750298535. - DOI - PubMed
MeSH terms
Substances
LinkOut - more resources
Full Text Sources
