Modeling the dependence of the period of intracellular Ca2+ waves on SERCA expression
- PMID: 12944265
- PMCID: PMC1303324
- DOI: 10.1016/S0006-3495(03)74580-9
Modeling the dependence of the period of intracellular Ca2+ waves on SERCA expression
Abstract
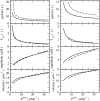
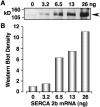
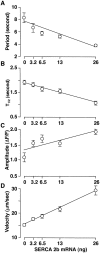
Contrary to intuitive expectations, overexpression of sarco-endoplasmic reticulum (ER) Ca(2+) ATPases (SERCAs) in Xenopus oocytes leads to a decrease in the period and an increase in the amplitude of intracellular Ca(2+) waves. Here we examine these experimental findings by modeling Ca(2+) release using a modified Othmer-Tang-model. An increase in the period and a reduction in the amplitude of Ca(2+) wave activity are obtained when increases in SERCA density are simulated while keeping all other parameters of the model constant. However, Ca(2+) wave period can be reduced and the wave amplitude and velocity can be significantly increased when an increase in the luminal ER Ca(2+) concentration due to SERCA overexpression is incorporated into the model. Increased luminal Ca(2+) occurs because increased SERCA activity lowers cytosolic Ca(2+), which is partially replenished by Ca(2+) influx across the plasma membrane. These simulations are supported by experimental data demonstrating higher luminal Ca(2+) levels, decreased periods, increased amplitude, and increased velocity of Ca(2+) waves in response to increased SERCA density.
Figures


Similar articles
-
Dual sensitivity of sarcoplasmic/endoplasmic Ca2+-ATPase to cytosolic and endoplasmic reticulum Ca2+ as a mechanism of modulating cytosolic Ca2+ oscillations.Biochem J. 2004 Oct 15;383(Pt 2):353-60. doi: 10.1042/BJ20040629. Biochem J. 2004. PMID: 15260801 Free PMC article.
-
Ca2+ wave dispersion and spiral wave entrainment in Xenopus laevis oocytes overexpressing Ca2+ ATPases.Biophys Chem. 1998 May 5;72(1-2):123-9. doi: 10.1016/s0301-4622(98)00128-8. Biophys Chem. 1998. PMID: 9652090 Review.
-
Interplay between SERCA and sarcolemmal Ca2+ efflux pathways controls spontaneous release of Ca2+ from the sarcoplasmic reticulum in rat ventricular myocytes.J Physiol. 2004 Aug 15;559(Pt 1):121-8. doi: 10.1113/jphysiol.2003.058917. Epub 2004 Jun 11. J Physiol. 2004. PMID: 15194743 Free PMC article.
-
Measurement and modeling of Ca2+ waves in isolated rabbit ventricular cardiomyocytes.Biophys J. 2007 Oct 1;93(7):2581-95. doi: 10.1529/biophysj.106.102293. Epub 2007 Jun 1. Biophys J. 2007. PMID: 17545234 Free PMC article.
-
Sarco/endoplasmic reticulum Ca2+ (SERCA)-pumps: link to heart beats and calcium waves.Cell Calcium. 1999 Apr;25(4):277-90. doi: 10.1054/ceca.1999.0032. Cell Calcium. 1999. PMID: 10456225 Review.
Cited by
-
Estradiol-Mediated Axogenesis of Hypothalamic Neurons Requires ERK1/2 and Ryanodine Receptors-Dependent Intracellular Ca2+ Rise in Male Rats.Front Cell Neurosci. 2019 Apr 2;13:122. doi: 10.3389/fncel.2019.00122. eCollection 2019. Front Cell Neurosci. 2019. PMID: 31001087 Free PMC article.
-
Dual sensitivity of sarcoplasmic/endoplasmic Ca2+-ATPase to cytosolic and endoplasmic reticulum Ca2+ as a mechanism of modulating cytosolic Ca2+ oscillations.Biochem J. 2004 Oct 15;383(Pt 2):353-60. doi: 10.1042/BJ20040629. Biochem J. 2004. PMID: 15260801 Free PMC article.
-
Luminal Ca2+ depletion during the unfolded protein response in Xenopus oocytes: cause and consequence.Cell Calcium. 2013 Apr;53(4):286-96. doi: 10.1016/j.ceca.2013.01.002. Epub 2013 Feb 12. Cell Calcium. 2013. PMID: 23415071 Free PMC article.
-
Spatiotemporal characteristics of calcium dynamics in astrocytes.Chaos. 2009 Sep;19(3):037116. doi: 10.1063/1.3206698. Chaos. 2009. PMID: 19792041 Free PMC article.
-
Multiscale Modeling Indicates That Temperature Dependent [Ca2+]i Spiking in Astrocytes Is Quantitatively Consistent with Modulated SERCA Activity.Neural Plast. 2015;2015:683490. doi: 10.1155/2015/683490. Epub 2015 Aug 4. Neural Plast. 2015. PMID: 26347125 Free PMC article.
References
-
- Allbritton, N. L., T. Meyer, and L. Stryer. 1992. Range of messenger action of calcium ion and inositol 1,4,5-trisphosphate. Science. 258:1812–1815. - PubMed
-
- Berridge, M., P. Lipp, and M. Bootman. 1999. Calcium signalling. Curr. Biol. 9:R157–R159. - PubMed
-
- Bezprozvanny, I., J. Watras, and B. E. Ehrlich. 1991. Bell-shaped calcium-response curves of Ins(1,4,5)P3- and calcium-gated channels from endoplasmic reticulum of cerebellum. Nature. 351:751–754. - PubMed
-
- Bootman, M. D., T. J. Collins, C. M. Peppiatt, L. S. Prothero, L. MacKenzie, P. De Smet, M. Travers, S. C. Tovey, J. T. Seo, M. J. Berridge, F. Ciccolini, and P. Lipp. 2001. Calcium signalling–an overview. Semin. Cell Dev. Biol. 12:3–10. - PubMed
-
- Camacho, P., and J. Lechleiter. 1993. Increased frequency of calcium waves in Xenopus laevis oocytes that express a calcium-ATPase. Science. 260:226–229. - PubMed
MeSH terms
Substances
LinkOut - more resources
Full Text Sources
Miscellaneous

