A tree-based algorithm for determining the effects of solvation on the structure of salivary gland tripeptide NH3+-D-PHE-D-GLU-GLY-COO-
- PMID: 12944268
- PMCID: PMC1303327
- DOI: 10.1016/S0006-3495(03)74583-4
A tree-based algorithm for determining the effects of solvation on the structure of salivary gland tripeptide NH3+-D-PHE-D-GLU-GLY-COO-
Abstract
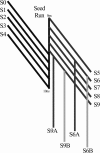
A D-enantiomeric analog of the submandibular gland rat-1 tripeptide FEG (Seq: NH(3)(+)-Phe-Glu-Gly-COO(-)) called feG (Seq: NH(3)(+)-D-Phe-D-Glu-Gly-COO(-)) was examined by molecular dynamics simulations in water. Previous in vacuo simulations suggested a conformation consisting predominantly of interactions between the Phe side chain and glutamyl-carboxyl group and a carboxyl/amino termini interaction. The solvated peptide was simulated using two approaches which were compared-a single 400-ns simulation and a "simulation tree." The "tree" approach utilized 45 10-ns simulations with different conformations used as initial structures for given trajectories. We demonstrate that multiple short duration simulations are able to describe the same conformational space as that described by longer simulations. Furthermore, previously described in vacuo interactions were confirmed with amendments: the previously described head-to-tail arrangement of the amino and carboxyl termini, was not observed; the interaction between the glutamyl carboxyl and Phe side chain describes only one of a continuum of conformations present wherein the aromatic residue remains in close proximity to the glutamyl carbonyl group, and also interacts with either of the two available carboxyl groups. Finally, utilizing only two separate 10-ns trajectories, we were able to better describe the conformational space than a single 60-ns trajectory, realizing a threefold decrease in the computational complexity of the problem.
Figures


Similar articles
-
Submandibular gland tripeptide FEG (Phe-Glu-Gly) and analogues: keys to structure determination.Peptides. 2002 Jan;23(1):193-9. doi: 10.1016/s0196-9781(01)00595-2. Peptides. 2002. PMID: 11814634
-
Molecular dynamics simulations of peptides and proteins with a continuum electrostatic model based on screened Coulomb potentials.Proteins. 2003 Apr 1;51(1):109-25. doi: 10.1002/prot.10330. Proteins. 2003. PMID: 12596268
-
The SAAP force field: development of the single amino acid potentials for 20 proteinogenic amino acids and Monte Carlo molecular simulation for short peptides.J Comput Chem. 2009 Oct;30(13):2039-55. doi: 10.1002/jcc.21196. J Comput Chem. 2009. PMID: 19140140
-
Investigation of aromatic-backbone amide interactions in the model peptide acetyl-Phe-Gly-Gly-N-methyl amide using molecular dynamics simulations and protein database search.J Am Chem Soc. 2001 Nov 28;123(47):11782-90. doi: 10.1021/ja011245u. J Am Chem Soc. 2001. PMID: 11716735
-
A molecular dynamics simulation of reactant mobility in an amorphous formulation of a peptide in poly(vinylpyrrolidone).J Pharm Sci. 2004 Apr;93(4):855-76. doi: 10.1002/jps.20004. J Pharm Sci. 2004. PMID: 14999724
Cited by
-
Enhancing Virtual Screening Performance of Protein Kinases with Molecular Dynamics Simulations.J Chem Inf Model. 2016 Oct 24;56(10):1923-1935. doi: 10.1021/acs.jcim.6b00261. Epub 2016 Oct 3. J Chem Inf Model. 2016. PMID: 27662181 Free PMC article.
References
-
- Angeletti, L. R., U. Agrimi, C. Curia, D. French, and R. Mariani-Constantini. 1992. Healing rituals and sacred serpents. Lancet. 340:223–225. - PubMed
-
- Balsera, M. A., W. Wriggers, Y. Oono, and K. Schulten. 1996. Principal component analysis and long time protein dynamics. J. Phys. Chem. 100:2567–2572.
-
- Berendsen, H. J. C., D. van der Spoel, and R. van Drunen. 1995. GROMACS: a message-passing parallel molecular dynamics implementation. Comp. Phys. Comm. 91:43–56.
-
- Burgi, R., X. Daura, A. Mark, M. Bellanda, S. Mammi, E. Peggion, and W. van Gunsteren. 2001. Folding study of an Aib-rich peptide in DMSO by molecular dynamics simulations. J. Pept. Res. 57:107–118. - PubMed
Publication types
MeSH terms
Substances
LinkOut - more resources
Full Text Sources
Miscellaneous

