. 2003 Sep;85(3):1560-75.
doi: 10.1016/S0006-3495(03)74588-3.

Enlargement and contracture of C2-ceramide channels

Affiliations

Enlargement and contracture of C2-ceramide channels

Leah J Siskind et al. Biophys J. 2003 Sep.

Abstract

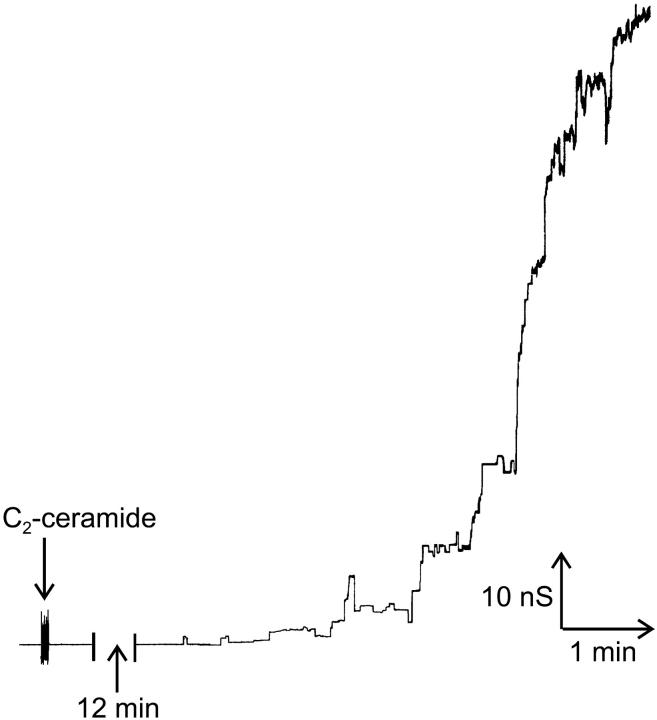
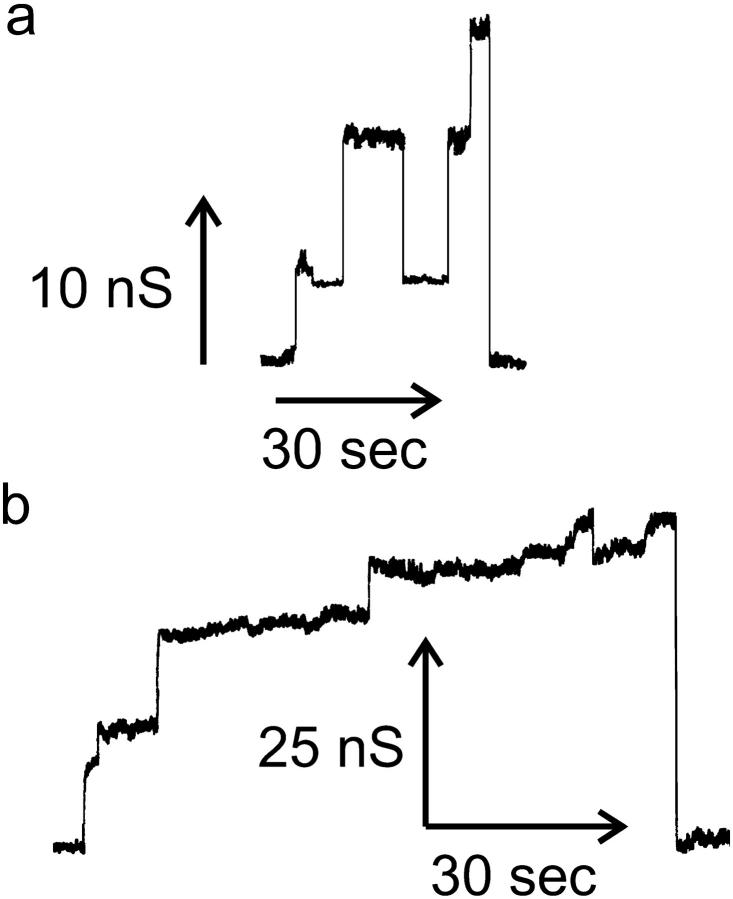
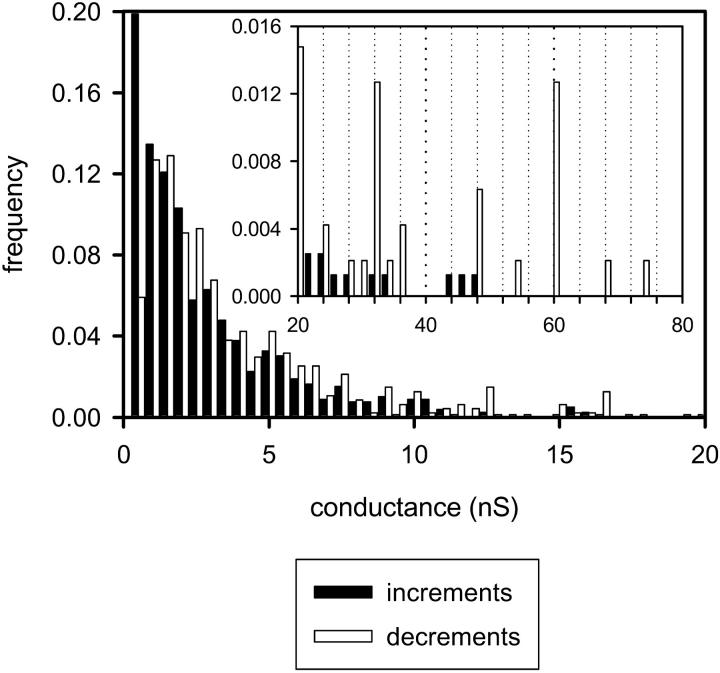
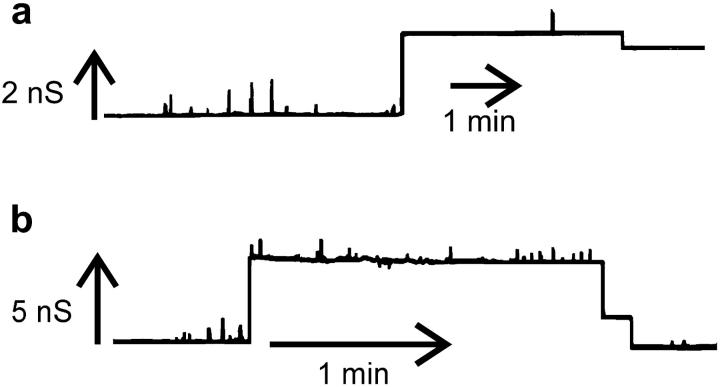
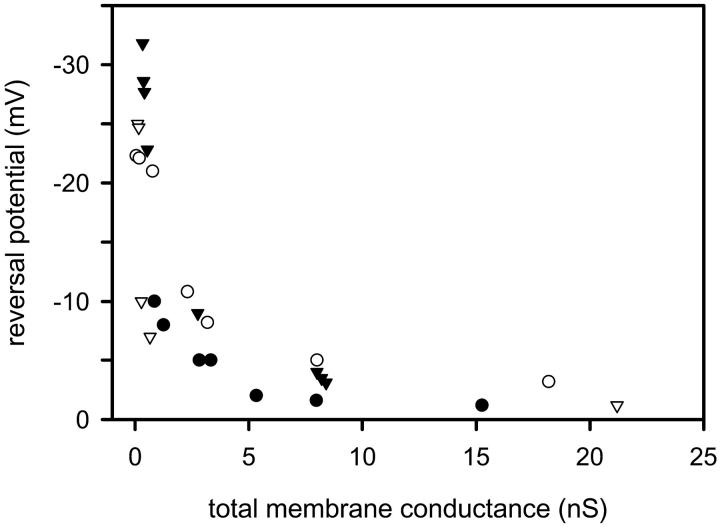
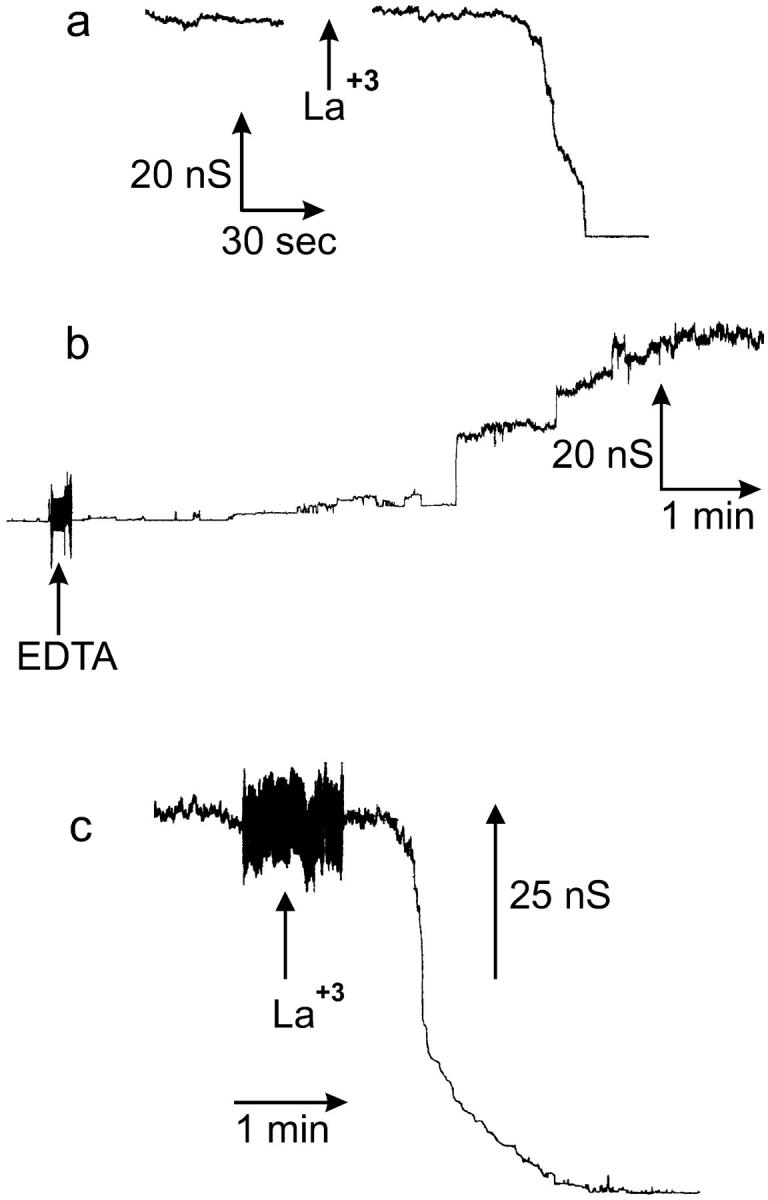
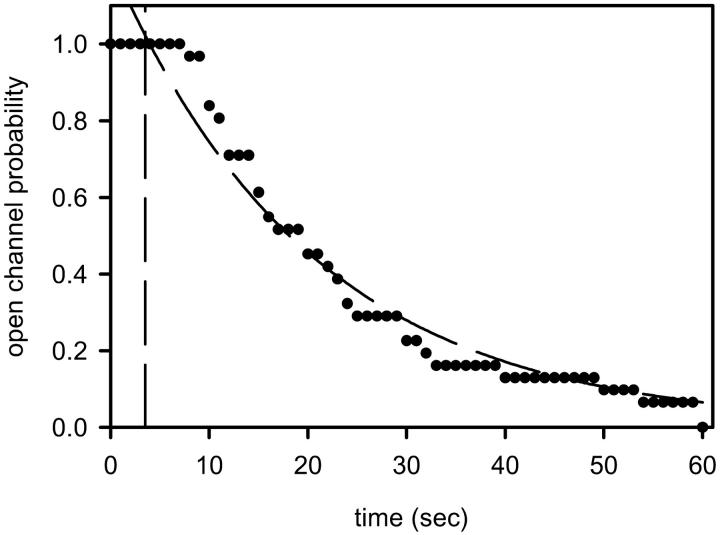
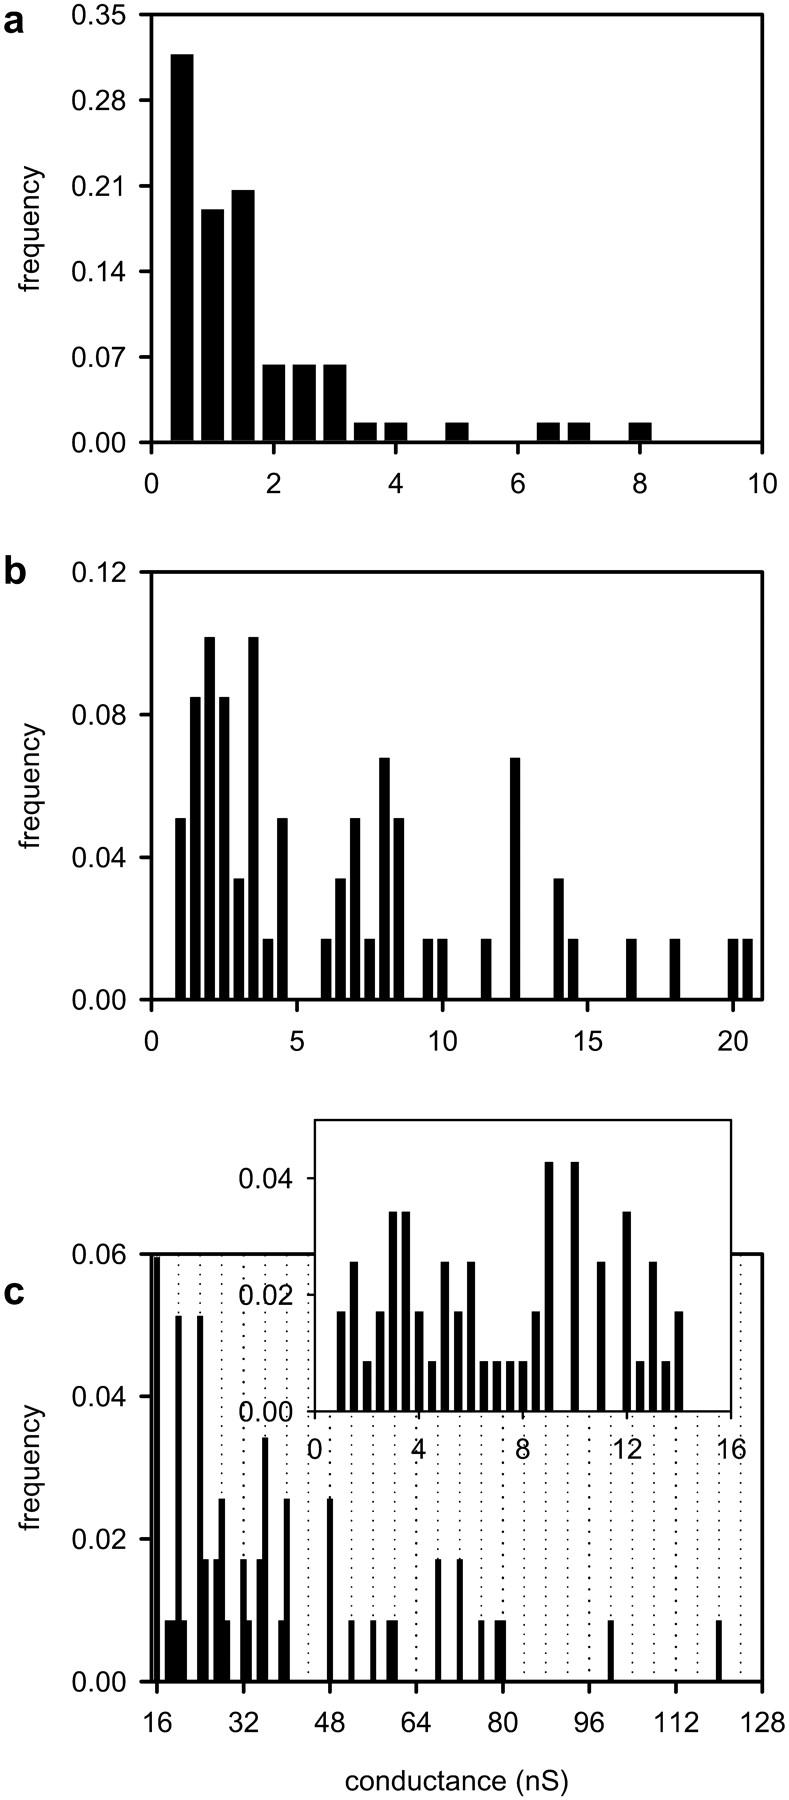
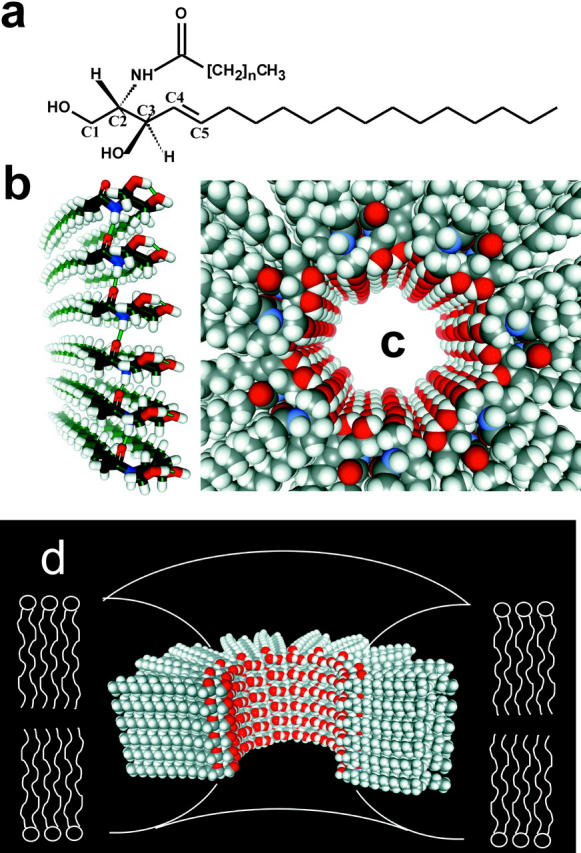
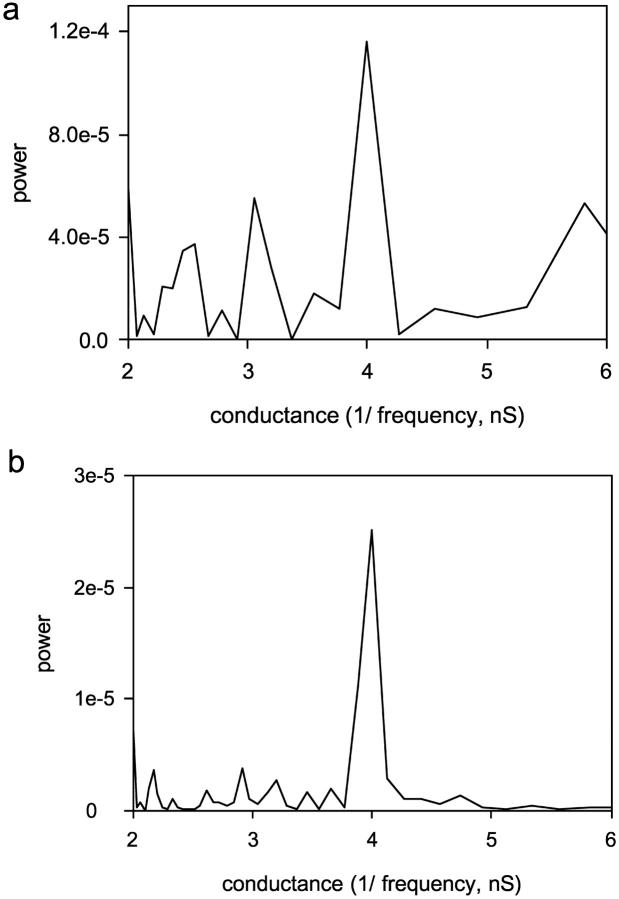
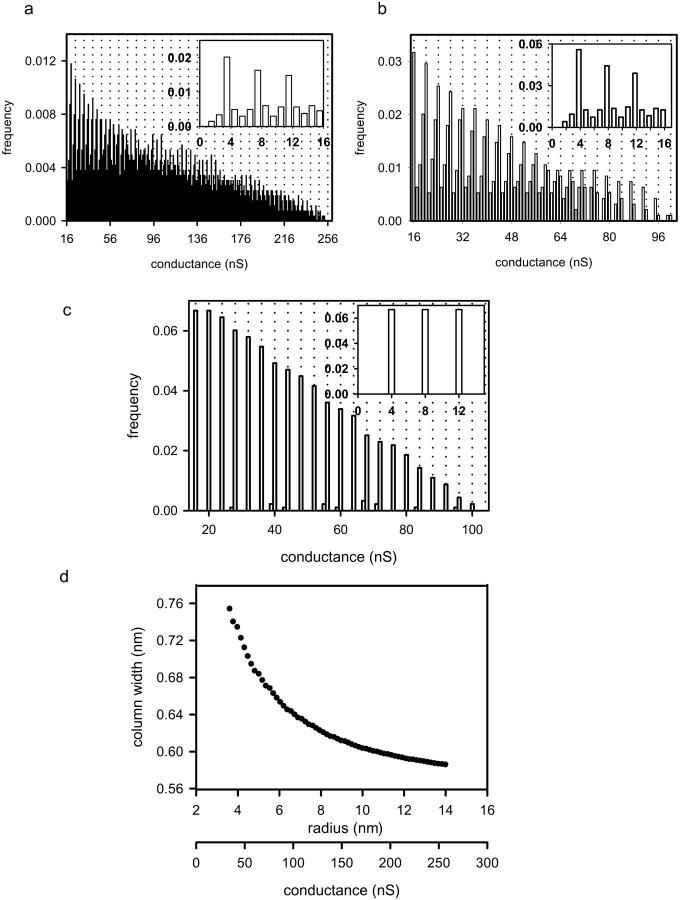
Ceramides are known to play a major regulatory role in apoptosis by inducing cytochrome c release from mitochondria. We have previously reported that ceramide, but not dihydroceramide, forms large and stable channels in phospholipid membranes and outer membranes of isolated mitochondria. C(2)-ceramide channel formation is characterized by conductance increments ranging from <1 to >200 nS. These conductance increments often represent the enlargement and contracture of channels rather than the opening and closure of independent channels. Enlargement is supported by the observation that many small conductance increments can lead to a large decrement. Also the initial conductances favor cations, but this selectivity drops dramatically with increasing total conductance. La(+3) causes rapid ceramide channel disassembly in a manner indicative of large conducting structures. These channels have a propensity to contract by a defined size (often multiples of 4 nS) indicating the formation of cylindrical channels with preferred diameters rather than a continuum of sizes. The results are consistent with ceramides forming barrel-stave channels whose size can change by loss or insertion of multiple ceramide columns.


Figures

FIGURE 1
FIGURE 1
A wide range of discrete conductance increases observed after the addition of C2-ceramide (25 nmol into 5 ml) to the aqueous solution on the cis side of a solvent-free planar phospholipid membrane as described in Materials and Methods. The monolayers were formed using 1% (w/v) asolectin, 0.2% (w/v) cholesterol in hexane and the aqueous buffer consisted of 1.0 M KCl, 1 mM MgCl2, 5 mM Tris (pH 7.5). The applied voltage was clamped at 10 mV (trans side is ground).
FIGURE 2
FIGURE 2
Evidence of channel enlargement from observations of small increases in conductance followed by one large conductance drop. The conditions were the same as in Fig. 1 except for the lipid composition used to form the monolayers was 0.5% (w/v) asolectin, 0.5% (w/v) DiPhyPC, and 0.1% (w/v) cholesterol in hexane.
FIGURE 3
FIGURE 3
A comparison of the distribution of conductance increments and decrements observed after the addition of C2-ceramide to the aqueous solution bathing planar phospholipid membranes. Conductance changes <20 nS are depicted in the larger figure, whereas the larger ones are depicted in the inset. Conditions were identical to those in Fig. 2. The bin size was 0.5 nS for the main figure and 1.5 nS for the inset. The data was compiled from 18 separate experiments. The vertical dotted lines are placed at conductance values that are multiples of 4.0 nS (20, 24, 28 nS, etc.).
FIGURE 4
FIGURE 4
Evidence of channel shrinkage from observations of a single conductance increment from baseline and subsequent decrement(s) to a lower conductance level. The conditions were identical to those in Fig. 2.
FIGURE 5
FIGURE 5
Evidence of channel expansion from selectivity measurements made after C2-ceramide addition as the conductance increased. Experiments were performed in the presence of a 10-fold KCl gradient (see Materials and Methods). The monolayers were formed with 0.5% (w/v) asolectin, 0.5% (w/v) DiPhyPC, 0.1% (w/v) cholesterol in hexane. The reversal potential (zero-current potential) was frequently measured as the recorded current changed to detect changes in selectivity. Results are representative of combined data from three separate experiments.
FIGURE 6
FIGURE 6
La+3 eliminates C2-ceramide conductance. (ac) Planar phospholipid membranes were formed from monolayers using a solution of 0.5% (w/v) asolectin, 0.5% (w/v) DiPhyPC, 0.1% (w/v) cholesterol in hexane, and the aqueous solution consisted of 1 M KCl, 1 mM MgCl2, 5 mM HEPES (a, b) or Tris (c) pH (7.0). C2-ceramide (5 μM) (25 nmol into 5 ml) was added to aqueous solution on the cis side of the membrane and the voltage was held constant at 10 mV. (a) LaCl3 added to the cis side (10 μM final) rapidly eliminated the C2-ceramide-induced conductance. (b) EDTA addition (10 μM final) restored ceramide conductance (HEPES concentration increased to 10 mM before addition of EDTA). (c) C2-ceramide-induced conductance is eliminated by a 150-nM free La+3 concentration. The free [La+3] was held constant by the La+3-buffer EDDA as described in the Materials and Methods section and the Appendix.
FIGURE 7
FIGURE 7
The observed likelihood of the C2-ceramide-induced conductance being unchanged after La+3 addition decays in essentially an exponential manner. For each time point after the addition of La+3, experiments were given ratings of one or zero, indicating no change or a decrease in conductance respectively. The values for each particular time point were combined between experiments and plotted against time. Results are a combination of data from 31 separate experiments. The vertical dashed line at 3.5 s represents the calculated diffusion time through the unstirred layers. The dashed line through the data is an exponential fit through data. The time constant is 29 s.
FIGURE 8
FIGURE 8
A comparison of the distributions of decrements observed after the La+3 addition for (a) low (<25 nS), (b) medium (from 25 to <100 nS), and (c) high (>100 nS) total initial membrane conductance. In c the decrements <16 nS are depicted in the inset, whereas those larger are depicted in the main figure. The vertical dotted lines are placed at conductance values that are multiples of 4.0 nS (i.e., 16, 20, 24 nS, etc.).
FIGURE 9
FIGURE 9
Structural model for ceramide channels. (a) C2-ceramide structure. (b) A column of ceramide residues held together by intermolecular hydrogen bonds between amide nitrogens and carbonyl groups. This column would span the hydrophobic portion of the membrane and in association with other columns would form pores of varying sizes. (c) Top view of a ceramide channel, consisting of 14 columns of ceramide molecules. Adjacent columns are oriented in an antiparallel fashion so that amide dipoles attract. The columns are held together via intermolecular hydrogen bonds between hydroxyl groups proposed to line the channel lumen. (d) A longitudinal cutaway of a ceramide channel, consisting of 14 columns of ceramide molecules, where four columns have been removed to show the interior of the channel. The curvature of the phospholipids of the membrane at the channel interface would minimize the exposure of the hydrophobic regions of the outer surface of the channel to the aqueous solution.
FIGURE 10
FIGURE 10
A fast Fourier transform analysis of conductance decrements ≥12 nS from the distributions in Fig. 3 (panel a) and in Fig. 8 c (panel b). The power spectrum of the fast Fourier transform (using the program Origin 6.1) was performed on all observed decrements ≥12 nS. Only a portion of the spectrum is shown with the x axis presented as the inverse of the frequency (in this case the conductance in nS).
FIGURE 11
FIGURE 11
All possible decrements that would result from the disassembly of a theoretical model ceramide channel consisting initially of 150 columns by the removal of two-column units were calculated utilizing Eq. 3 (see text). (a) Fixed column width of 0.586 nm; (b) fixed column width of 0.586 nm and the upper limit of one-third for the fraction of columns lost in any single decrement event; (c) the same constraint as in b but with the column width adjusted to yield multiples of four; (d) the relationship between column width and channel radius/conductance from c required to achieve a periodicity of four.

Similar articles

Cited by

References

    1. Akutsu, H., and J. Seelig. 1981. Interaction of metal ions with phosphatidylcholine bilayer membranes. Biochemistry. 20:7366–7373. - PubMed
    1. Amarante-Mendes, G. P., C. Naekyung Kim, L. Liu, Y. Huang, C. L. Perkins, D. R. Green, and K. Bhalla. 1998. Bcr-Abl exerts its antiapoptotic effect against diverse apoptotic stimuli through blockage of mitochondrial release of cytochrome c and activation of caspase-3. Blood. 91:1700–1705. - PubMed
    1. Antonsson, B., S. Montessuit, S. Lauper, R. Eskes, and J. C. Martinou. 2000. Bax oligomerization is required for channel-forming activity in liposomes and to trigger cytochrome c release from mitochondria. Biochem. J. 345:271–278. - PMC - PubMed
    1. Antonsson, B., S. Montessuit, B. Sanchez, and J. C. Martinou. 2001. Bax is present as a high molecular weight oligomer/complex in the mitochondrial membrane of apoptotic cells. J. Biol. Chem. 276:11615–11623. - PubMed
    1. Ariga, T., W. D. Jarvis, and R. K. Yu. 1998. Role of sphingolipid-mediated cell death in neurodegenerative diseases. J. Lipid Res. 39:1–16. - PubMed

Publication types