. 2003 Sep;85(3):1585-99.
doi: 10.1016/S0006-3495(03)74590-1.

Lipid bilayer vesicle fusion: intermediates captured by high-speed microfluorescence spectroscopy

Affiliations

Lipid bilayer vesicle fusion: intermediates captured by high-speed microfluorescence spectroscopy

Guohua Lei et al. Biophys J. 2003 Sep.

Abstract

The fusion of lipid bilayers can be visualized under the fluorescence microscope, but the process is very fast and requires special techniques for its study. It is reported here that vesicle fusion is susceptible to analysis by microspectrofluorometry and that for the first time, the entire fusion process has been captured. In the case of giant (>10- micro m diameter) bilayer vesicles having a high density of opposite charge, fusion proceeds through stages of adhesion, flattening, hemifusion, elimination of the intervening septum, and uptake of excess membrane to generate a spherical product very rapidly. These investigations became possible with a fluorescence microscope that was modified for recording of images simultaneously with the collection of fluorescence emission spectra from many (>100) positions along the fusion axis. Positively-charged vesicles, composed of O-ethylphosphatidylcholine and dioleoylphosphatidylcholine, were labeled with a carbocyanine fluorophore. Negatively-charged vesicles, composed of dioleoylphosphatidylglycerol and dioleoylphosphatidylcholine, were labeled with a rhodamine fluorophore that is a resonance energy transfer acceptor from the carbocyanine fluorophore. An electrophoretic chamber allowed selection of pairs of vesicles to be brought into contact and examined. Spectral changes along the axis of fusion were captured at high speed (a few ms/frame) by operating a sensitive digital camera in the virtual-chip mode, a software/hardware procedure that permits rapid readout of selected regions of interest and by pixel binning along the spectral direction. Simultaneously, color images were collected at video rates (30 frame/s). Comparison of the spectra and images revealed that vesicle fusion typically passes through a hemifusion stage and that the time from vesicle contact to fusion is <10 ms. Fluorescence spectra are well suited to rapid collection in the virtual-chip mode because spectra (in contrast to images) are accurately characterized with a relatively small number of points and interfering signals can be removed by judicious choice of barrier filters. The system should be especially well-suited to phenomena exhibiting rapid fluorescence change along an axis; under optimal conditions, it is possible to obtain sets of spectra (wavelength range of approximately 150 nm) at >100 positions along a line at rates >1000 frames/s with a spectral resolution of approximately 10 nm and spatial resolution at the limit of the light microscope ( approximately 0.2 micro m).


Figures

FIGURE 1
FIGURE 1
Top view of electrophoretic chamber for vesicle control. The chamber is filled with ∼3 ml solution, then vesicle suspensions are added to the opposite ends of a channel. A small volume of solution (∼1 ml) is sucked out from one end of the perpendicular channel to bring the residual vesicles together at the intersection in the center. Suitable oppositely-charged vesicles are brought to contact by controlling the polarity of the two sets of electrodes; one polarity is shown, but a switch allows reversal of polarity of each pair of electrodes independently.
FIGURE 2
FIGURE 2
Schematic diagram of the spectrometer and imaging system.
FIGURE 3
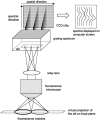
FIGURE 3
Illustration of the relationship between the region in the object being examined and the dispersion of the light from it by a spectrometer grating. The light (fluorescence) from vesicles is collected by the fluorescence microscope and passes through the entrance slit of the spectrometer. The light is dispersed into its spectral components by the grating, and then projected onto the CCD chip. From the chip, the signal is transferred to computer where the spectra are displayed and stored. It should be noted that the light is collected from a region in the object defined by the projection of the slit onto the object. Hence, spectra are obtained from segments along the slit projection corresponding to columns of pixels in the y-direction, normal to the axis of the slit. For simplicity, only a few spectra are shown. In fact, for the camera described here, 512 spectra may be obtained simultaneously.
FIGURE 4
FIGURE 4
The spectrum of a DiO-labeled vesicle at a single position (1 pixel at the CCD chip, corresponding to 0.15 mm in the image plane) along the spatial direction and its fitted curve. (A) 90 pixels in the spectral dimension were used with 9:1 binning and the frame rate was 1060 fps. The labeled numbers on the curve are standard deviations (from 30 frames). The spectrometer entrance slit width was 20 μm, corresponding to 0.2 μm in the image plane. The spectrum shown is one of 10 spectra, each from a single region with nominal dimensions of 15 μm × 15 μm on the CCD chip. The camera gain setting was 80%. (B) 160 pixels in spectral direction with a rate of 195 fps. The spectrometer entrance slit width was 100 μm, corresponding to 1 μm in the image plane. The camera gain setting was 80%.
FIGURE 5
FIGURE 5
Effect of the entrance slit width of the spectrometer on the S/N ratio taken at peak of the spectral band. A 1.0-μm fluorescent microsphere was used as the object. The camera gain setting was 70%. The virtual-chip area was 100 (spatial direction) × 160 (spectral direction) pixels and 10:1 binning was done in the spectral direction. The frame rate was 650 fps. The change in slope at ∼100 μm on the curve corresponds to the point where the projection of the slit width became equal to the diameter of the microsphere.
FIGURE 6
FIGURE 6
Effect of the virtual-chip scanning area or frame rate on the S/N ratio. The virtual scanning area was changed by increasing the number of pixels of the region of interest in the y-direction, and the dimension in the x-direction was held constant. The scanning areas were 160 × 100, 150 × 100, 140 × 100, ……10 × 100 pixels. The scanning time or frame rates corresponding to scanning area were also recorded, and are shown on the lower horizontal axis.
FIGURE 7
FIGURE 7
A single vesicle fluorescence image and spectra. (A) The fluorescence image of a vesicle labeled with DiO. The gray bar in the middle of the image represents the virtual projection of the spectrometer slit (it is 1.0-μm wide) on the vesicle. (B) The vesicle spectral distribution along spectral entrance slit direction. This is one of the DiO spectra acquired along the length of the gray rectangle as shown in A. There were 320 pixels (∼50 μm, so a spectrum was nominally collected every 50/320 = 0.16 μm) in spatial direction, 160 pixels with 10:1 binning in the spectral direction, and the frame rate was 470 fps. (C) Fluorescence intensity profile of the vesicle along the slit direction. (D) DiO fluorescence spectrum obtained from B. The circles are the original data from B at position of 33 μm; the line is the fitted curve.
FIGURE 8
FIGURE 8
Video images of contact and weak adhesion, without further interaction, of two vesicles with low surface charge density (10% of full charge). (A) Time course before contact. (B) Time course at vesicle contact (0 ms). The color changed to yellow in the contact zone, suggesting overlap of red and green emission and probably not very much energy transfer, although quantitation is problematic. (C) A small increase in adhesion is indicated by the increase of area that became yellow (66 ms). (D) The vesicles are very slightly more adherent, although the yellow color intensity has not increased significantly (132 ms).
FIGURE 9
FIGURE 9
Time course of spectral change during two contacts of the two vesicles shown in Fig. 8. (A) Time course of spectra before vesicle contact. (B) Time course of spectra at vesicle contact (0 ms). (C and D) Spectra at 65 and at 130 ms. The spectral range is from 500 to 650 nm (from front to back). Slit width was 200 μm. The lack of spectral change reveals that there is essentially no energy transfer across the contact region, despite the fact that these vesicles are adherent, albeit weakly.
FIGURE 10
FIGURE 10
Hemifusion video images. Vesicles had moderate net charges (24%). Time sequence of the images: (A) Before the vesicles contacted. (B) Two vesicles contact (at 0 ms). (C) Contact zone formed (at 33 ms). (D) Stable contact (at 66 ms). (E) Contact area color changed from yellow to red (at 99 ms). At the same time, red fluorescence appeared on the green vesicle, showing that Rh-PE diffused from the negatively- to the positively-charged vesicle. (FI) Images at 132, 165, 231, and 330 ms after contact. (J) At 660 ms after contact; the green color was significantly quenched and the red color increased along the vesicle contact area. Hemifusion as a stable final state is commonly seen with vesicles having an intermediate content of charged lipid.
FIGURE 11
FIGURE 11
Spectral change with time during vesicle hemifusion. The video images are shown in Fig. 10. (A) Time course of spectra before two vesicles contacted. (B) Time course of spectra at 0 ms (time of contact). (CF) Spectra at 5, 10, 15, and 385 ms after vesicle contact. The spectral range is from ∼500 to 650 nm (from front to back). Slit width was 200 μm.
FIGURE 12
FIGURE 12
Video images of full fusion. Vesicles contained a high proportion of lipids with a net charge (54%). (A) Time sequence before two vesicles contacted (at 0 ms). (B) Time sequence at full fusion (at 33 ms). (CF) Images at 99, 330, 660, and 6600 ms. Fluorescent probes have diffused along the membranes. Some small pink particles appeared on the inside of the fused vesicles; these regions are probably invaginations and represent the area that became excess when the two vesicles fused at constant volume.
FIGURE 13
FIGURE 13
Time course of spectral change during vesicle fusion. The video images are shown in Fig. 12. (A) Time sequence of spectra before the vesicles contacted. (B) Time sequence of vesicles contacted (at 0 ms). (CH) Spectra at 5, 10, 15, 385, 465, and 1025 ms after vesicles contacted. The spectral range is from ∼500 to 650 nm (from front to back). Slit width was 200 μm.
FIGURE 14
FIGURE 14
Processes and tensions involved in contact fusion of oppositely-charged vesicles. The figure shows the progression of events that may be presumed to occur between contact and full fusion of two oppositely-charged vesicles. The thick, gray lines represent monolayers; each circle consists of two such lines, hence is a single bilayer vesicle. 1. Vesicles contact. 2. Vesicles adhere and begin to flatten. Vectors show components of tension acting at edge of contact surface. 3. The tension in the vesicle bilayers has come into equilibrium with the adhesion force. 4. During flattening, the two surfaces neutralize each other, reducing repulsion within each monolayer and inducing a tendency to condense to a smaller area/molecule. (Curved arrows on monolayer surfaces are a reminder that the bilayer tension operates over the whole surface, although there may be a transient differential tension between inner and outer monolayers as the contact zone monolayer condenses.) 5. External monolayers rend within the contact zone; the inner monolayers fill the gaps so-created. 6. The residual tension in both vesicles now acts on a single bilayer that spans the gap in the hemifusion region and if it exceeds the lysis tension of that bilayer, full fusion ensues.

Similar articles

Cited by

References

    1. Akashi, K., H. Miyata, H. Itoh, and K. Kinosita, Jr. 1996. Preparation of giant liposomes in physiological conditions and their characterization under an optical microscope. Biophys. J. 71:3242–3250. - PMC - PubMed
    1. Angelova, M. I., and D. S. Dimitrov. 1986. Liposome electroformation. Faraday Discuss. Chem. Soc. 81:303–311.
    1. Angelova, M. I., S. Soleau, P. Meleard, J. F. Faucon, and P. Bothorel. 1992. Preparation of giant vesicles by external AC electric fields. Kinetics and applications. Prog. Coll. Polym. 89:127–131.
    1. Chanturiya, A., P. Scaria, O. Kuksenok, and M. C. Woodle. 2002. Probing the mechanism of fusion in a two-dimensional computer simulation. Biophys. J. 82:3072–3080. - PMC - PubMed
    1. Chanturiya, A., P. Scaria, and M. C. Woodle. 2000. The role of membrane lateral tension in calcium-induced membrane fusion. J. Membr. Biol. 176:67–75. - PubMed

Publication types