

Stimulation of single isolated adult ventricular myocytes within a low volume using a planar microelectrode array
- PMID: 12944291
- PMCID: PMC1303350
- DOI: 10.1016/S0006-3495(03)74606-2
Stimulation of single isolated adult ventricular myocytes within a low volume using a planar microelectrode array
Abstract
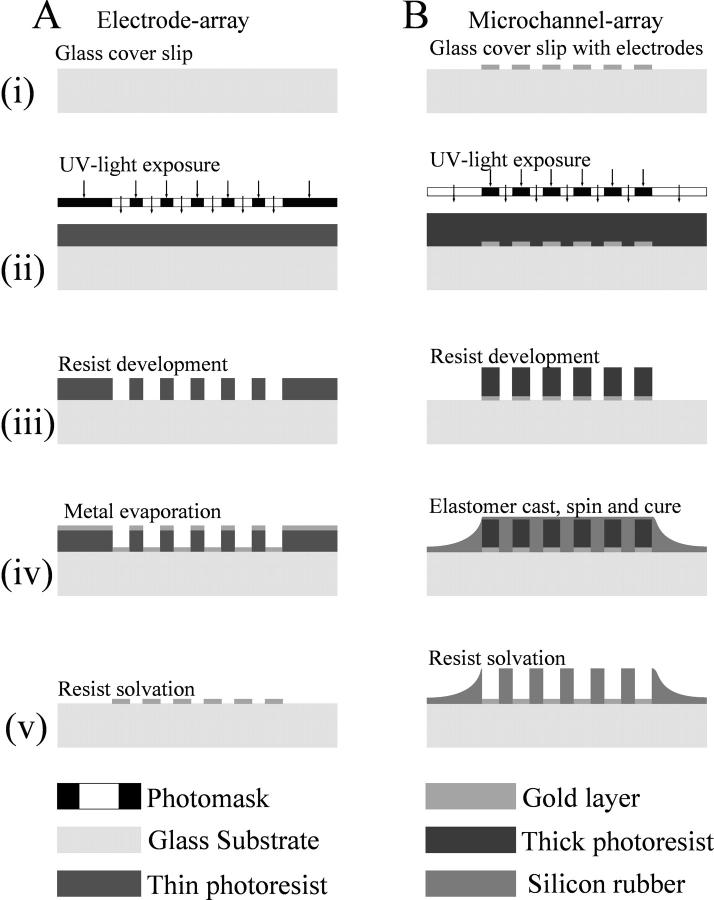
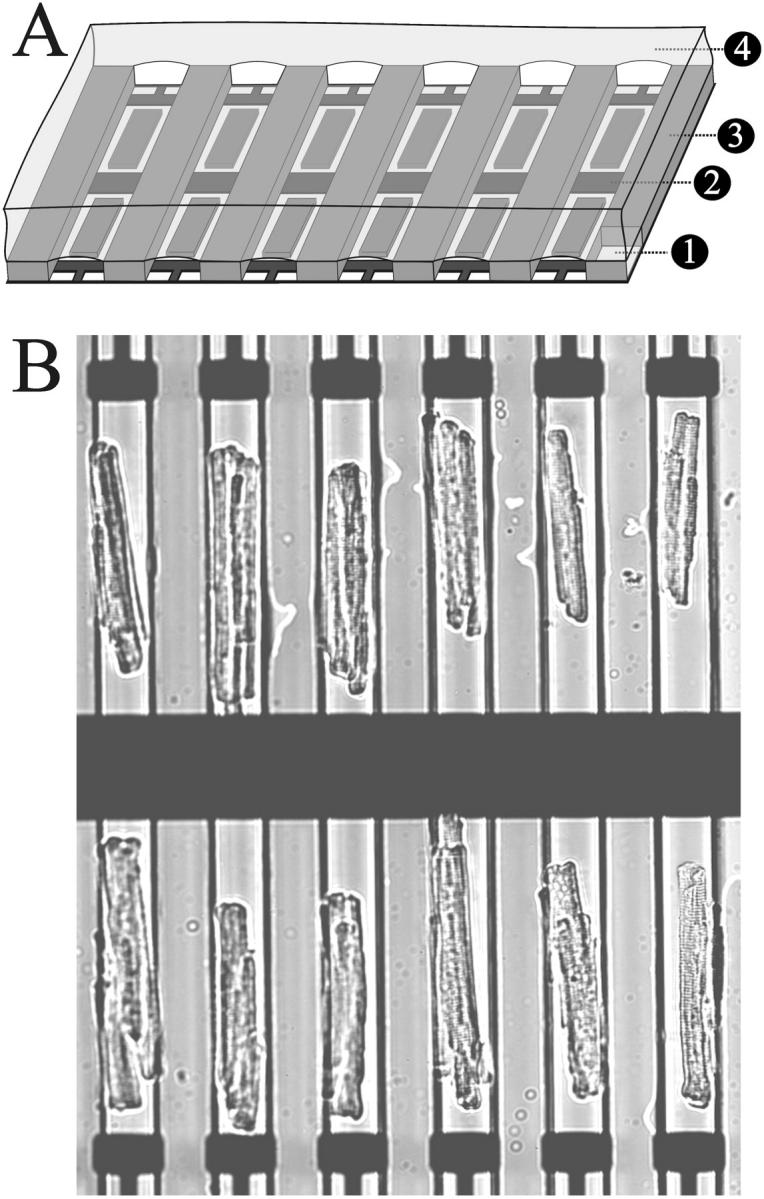
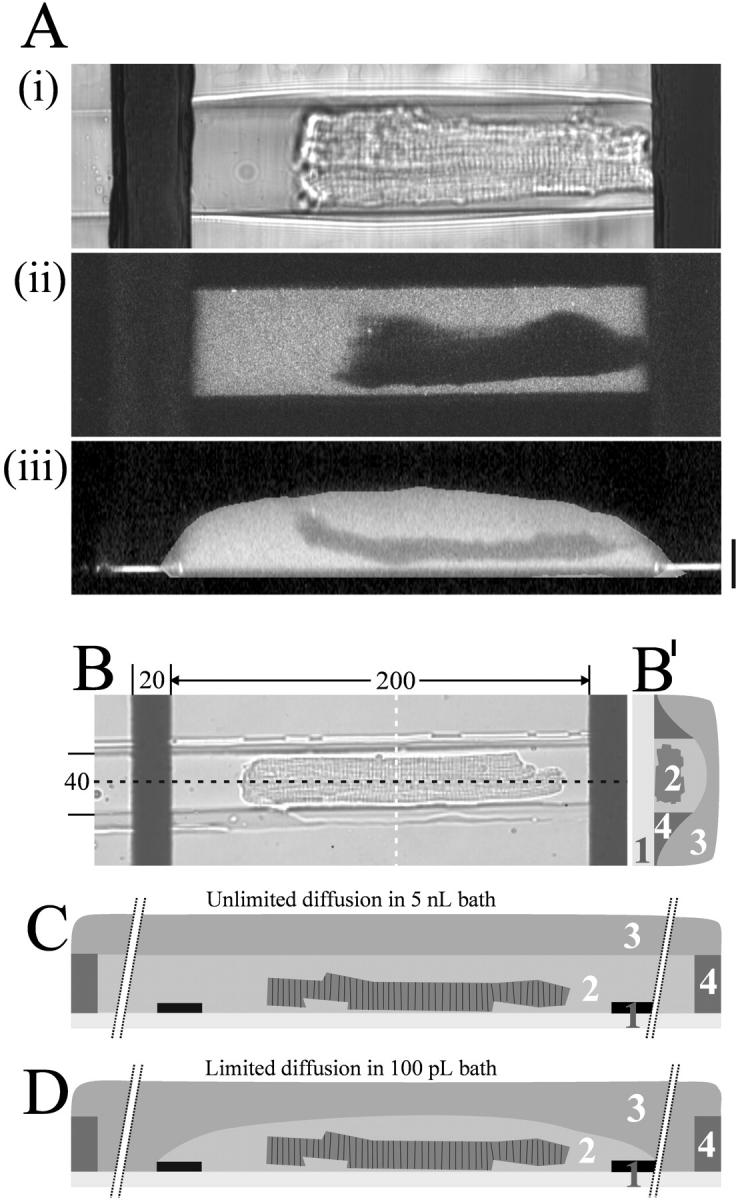
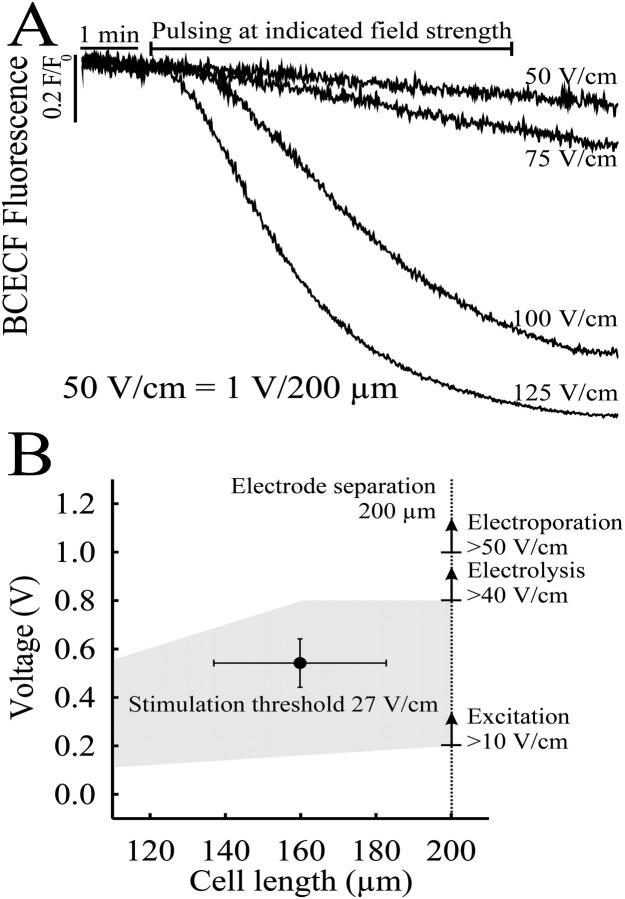
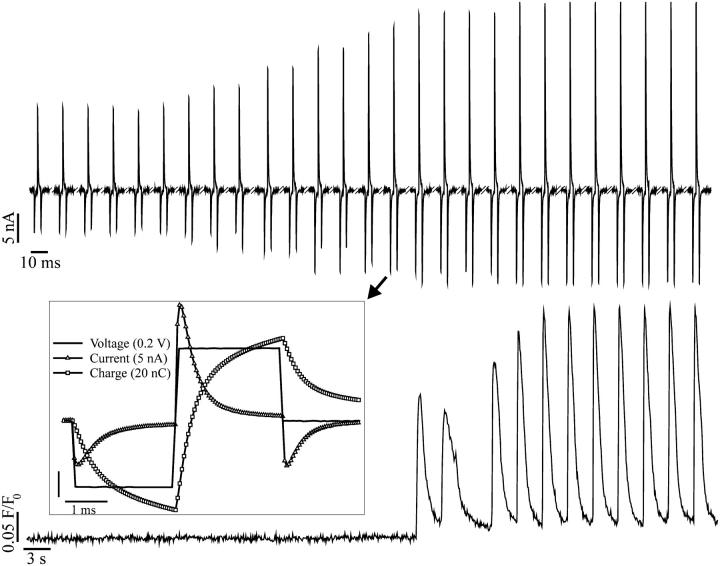
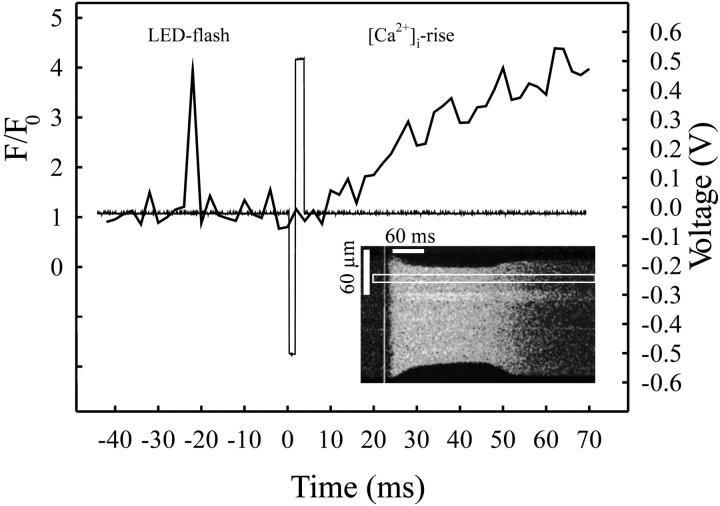
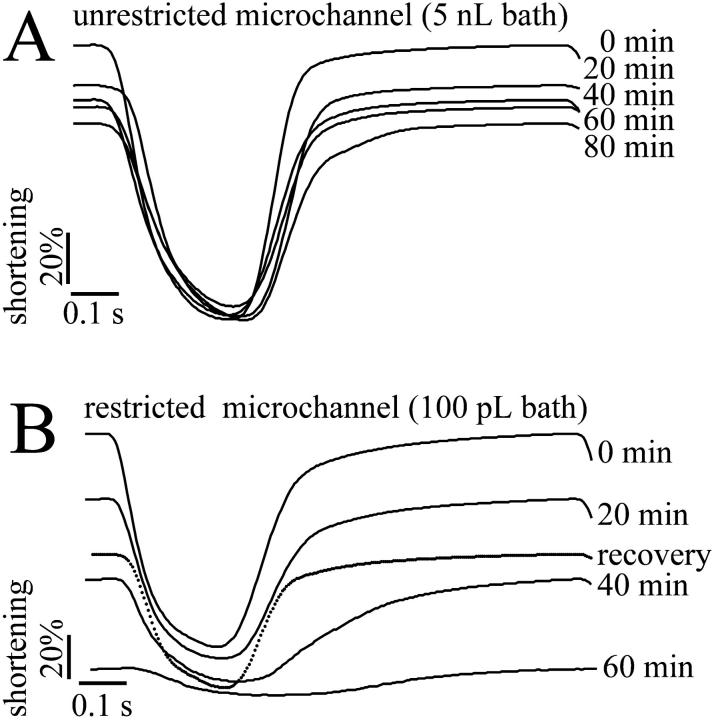
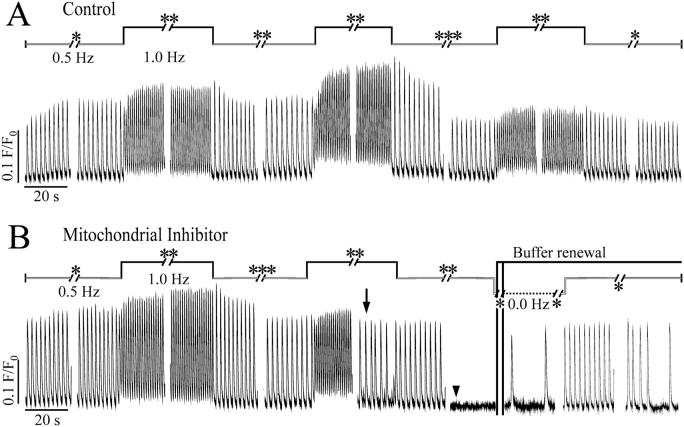
Microchannels (40- microm wide, 10- microm high, 10-mm long, 70- microm pitch) were patterned in the silicone elastomer, polydimethylsiloxane on a microscope coverslip base. Integrated within each microchamber were individually addressable stimulation electrodes (40- microm wide, 20- microm long, 100-nm thick) and a common central pseudo-reference electrode (60- microm wide, 500- microm long, 100-nm thick). Isolated rabbit ventricular myocytes were introduced into the chamber by micropipetting and subsequently capped with a layer of mineral oil, thus creating limited volumes of saline around individual myocytes that could be varied from 5 nL to 100 pL. Excitation contraction coupling was studied by monitoring myocyte shortening and intracellular Ca(2+) transients (using Fluo-3 fluorescence). The amplitude of stimulated myocyte shortening and Ca(2+) transients remained constant for 90 min in the larger volume (5 nL) configuration, although the shortening (but not the Ca(2+) transient) amplitude gradually decreased to 20% of control within 60 min in the low volume (100 pL) arrangement. These studies indicate a lower limit for the extracellular volume required to stimulate isolated adult cardiac myocytes. Whereas this arrangement could be used to create a screening assay for drugs, individual microchannels (100 pL) can also be used to study the effects of limited extracellular volume on the contractility of single cardiac myocytes.
Figures
Similar articles
-
Stimulation of isolated ventricular myocytes within an open architecture microarray.IEEE Trans Biomed Eng. 2005 Mar;52(3):531-8. doi: 10.1109/TBME.2004.842971. IEEE Trans Biomed Eng. 2005. PMID: 15759583
-
S100A1 increases the gain of excitation-contraction coupling in isolated rabbit ventricular cardiomyocytes.J Mol Cell Cardiol. 2005 Dec;39(6):900-10. doi: 10.1016/j.yjmcc.2005.06.018. Epub 2005 Oct 17. J Mol Cell Cardiol. 2005. PMID: 16236309
-
Microfluidic cell arrays for metabolic monitoring of stimulated cardiomyocytes.Electrophoresis. 2010 Apr;31(8):1405-13. doi: 10.1002/elps.200900579. Electrophoresis. 2010. PMID: 20333720
-
A microfluidic device to confine a single cardiac myocyte in a sub-nanoliter volume on planar microelectrodes for extracellular potential recordings.Lab Chip. 2004 Aug;4(4):357-62. doi: 10.1039/b315648f. Epub 2004 May 12. Lab Chip. 2004. PMID: 15269804
-
Cardiac-specific overexpression of Galphaq alters excitation-contraction coupling in isolated cardiac myocytes.J Mol Cell Cardiol. 1999 Jul;31(7):1327-36. doi: 10.1006/jmcc.1999.0966. J Mol Cell Cardiol. 1999. PMID: 10403750
Cited by
-
Single-cell electric lysis on an electroosmotic-driven microfluidic chip with arrays of microwells.Sensors (Basel). 2012;12(6):6967-77. doi: 10.3390/s120606967. Epub 2012 May 25. Sensors (Basel). 2012. PMID: 22969331 Free PMC article.
-
Electrical Field Stimulation with a Novel Platform: Effect on Cardiomyocyte Gene Expression but not on Orientation.Int J Biomed Sci. 2012 Jun;8(2):109-20. Int J Biomed Sci. 2012. PMID: 23675263 Free PMC article.
-
Extracellular recordings of field potentials from single cardiomyocytes.Biophys J. 2006 Oct 1;91(7):2543-51. doi: 10.1529/biophysj.106.085183. Epub 2006 Jul 14. Biophys J. 2006. PMID: 16844752 Free PMC article.
-
Single-cell chemical lysis on microfluidic chips with arrays of microwells.Sensors (Basel). 2012;12(1):347-58. doi: 10.3390/s120100347. Epub 2011 Dec 30. Sensors (Basel). 2012. PMID: 22368473 Free PMC article.
-
Heart-on-Chip for Combined Cellular Dynamics Measurements and Computational Modeling Towards Clinical Applications.Ann Biomed Eng. 2022 Feb;50(2):111-137. doi: 10.1007/s10439-022-02902-7. Epub 2022 Jan 17. Ann Biomed Eng. 2022. PMID: 35039976 Review.
References
-
- Babcock, D. F., and B. Hille. 1998. Mitochondrial oversight of cellular Ca2+ signalling. Curr. Opin. Neurobiol. 8:398–404. - PubMed
-
- Bratten, C. D. T., P. H. Cobbold, and J. M. Cooper. 1998. Single-cell measurements of purine release using a micromachined electroanalytical sensor. Anal. Chem. 70:1164–1170. - PubMed
-
- Cai, X., N. Klauke, A. Glidle, P. Cobbold, G. Smith, and J. M. Cooper. 2001. Ultra-low-volume, real-time measurements of lactate from the single heart cell using microsystems technology. Anal. Chem. 74:908–914. - PubMed
-
- Cannon, D. M., Jr., N. Winograd, and A. G. Ewing. 2000. Quantitative chemical analysis of single cells. Annu. Rev. Biophys. Biomol. Struct. 29:239–263. - PubMed
-
- Cheng, D. K.-L., L. Tung, and E. A. Sobie. 1999. Nonuniform responses of transmembrane potential during electric field stimulation of single cardiac cells. Am. J. Physiol. 277:H351–H362. - PubMed
MeSH terms
Substances
LinkOut - more resources
Full Text Sources
Other Literature Sources
Miscellaneous
