. 2003 Sep;85(3):1787-804.
doi: 10.1016/S0006-3495(03)74608-6.

Formation pathways of a guanine-quadruplex DNA revealed by molecular dynamics and thermodynamic analysis of the substates

Affiliations

Formation pathways of a guanine-quadruplex DNA revealed by molecular dynamics and thermodynamic analysis of the substates

Richard Stefl et al. Biophys J. 2003 Sep.

Abstract

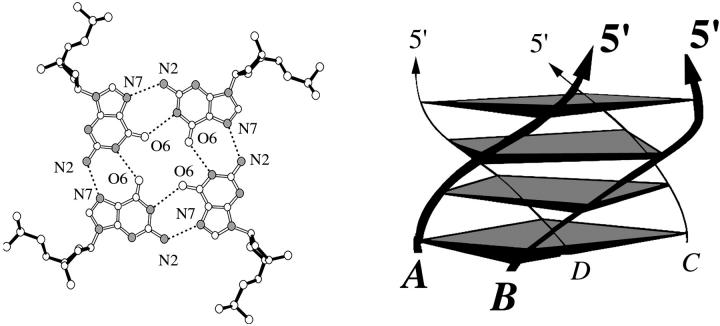
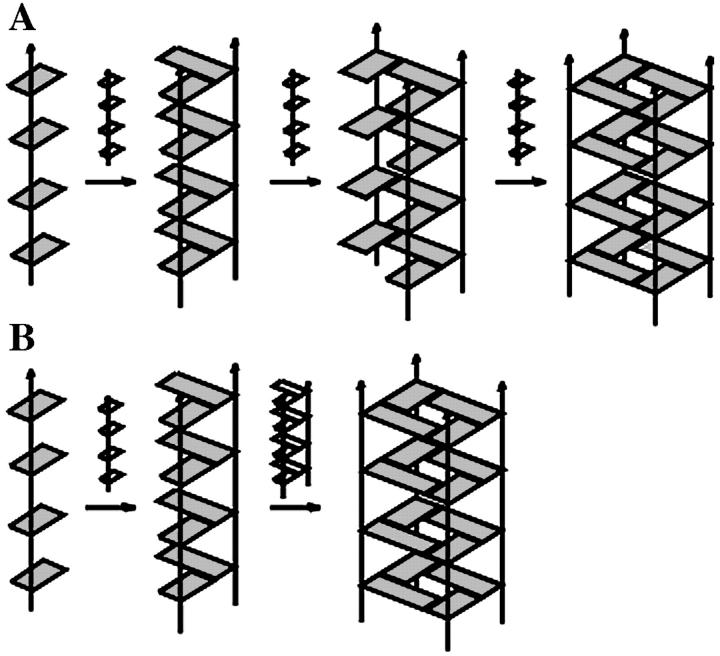
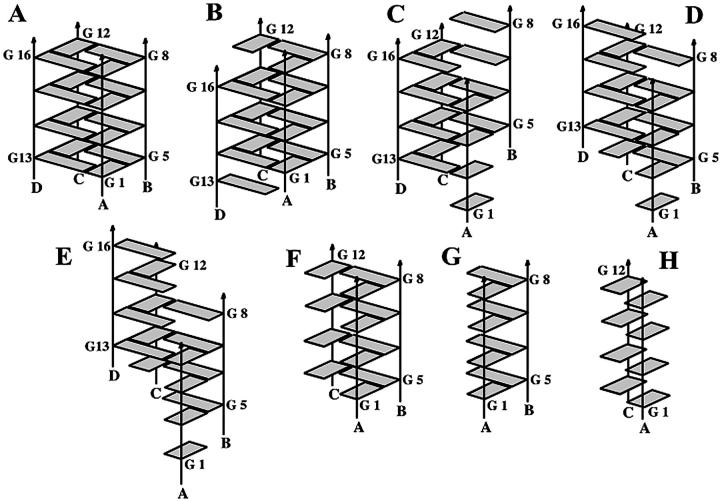
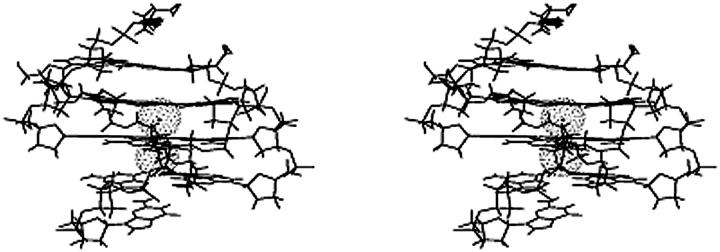
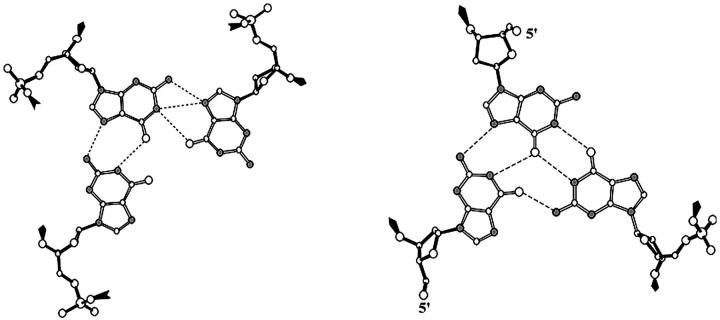
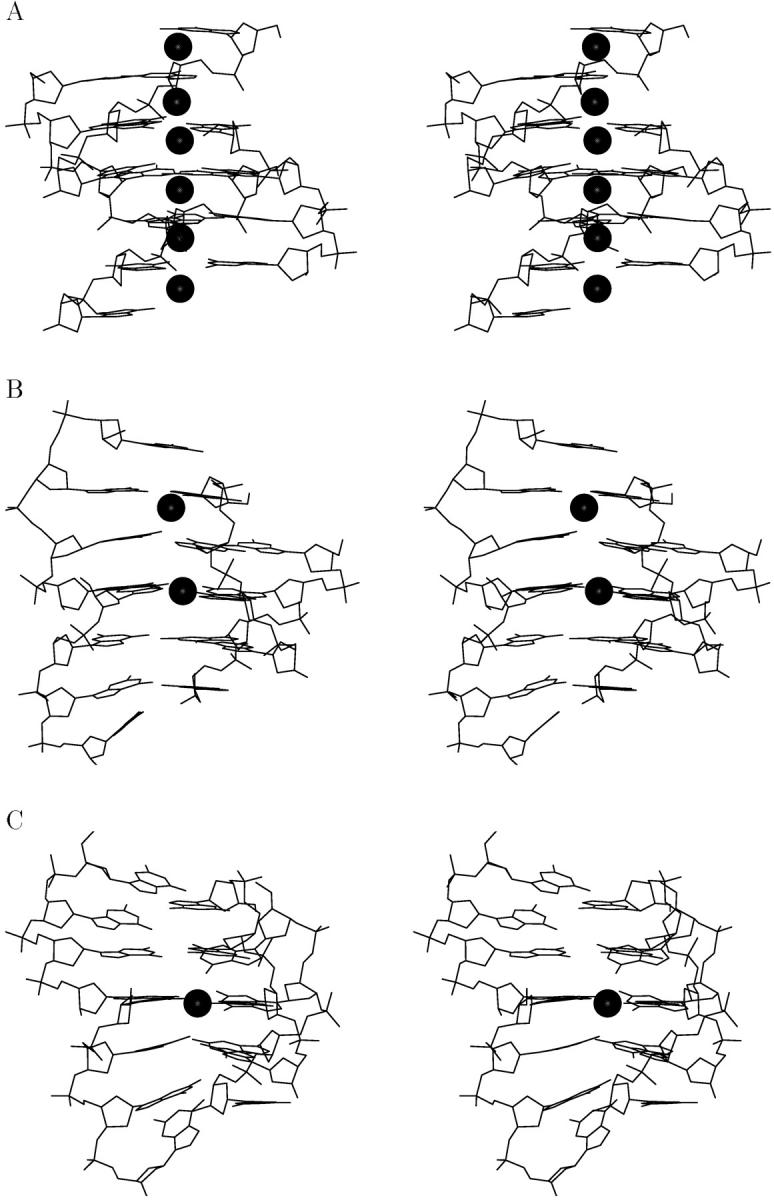
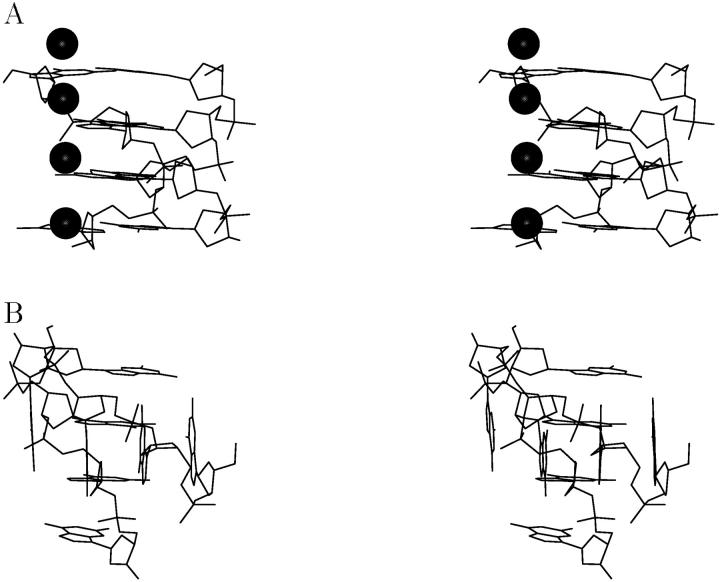
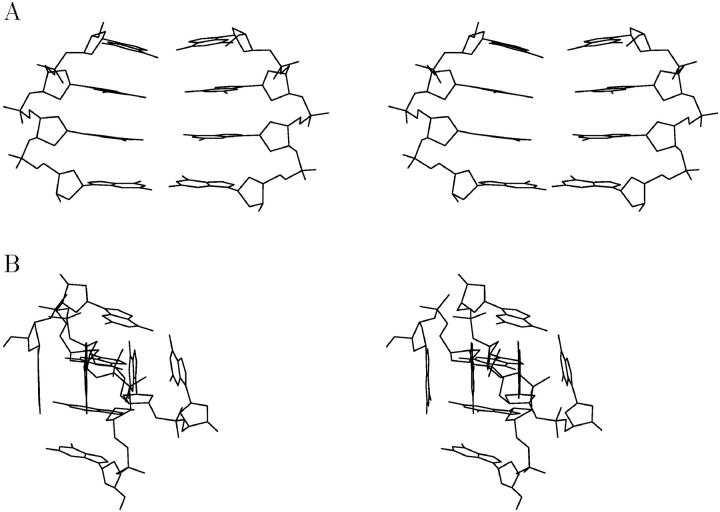
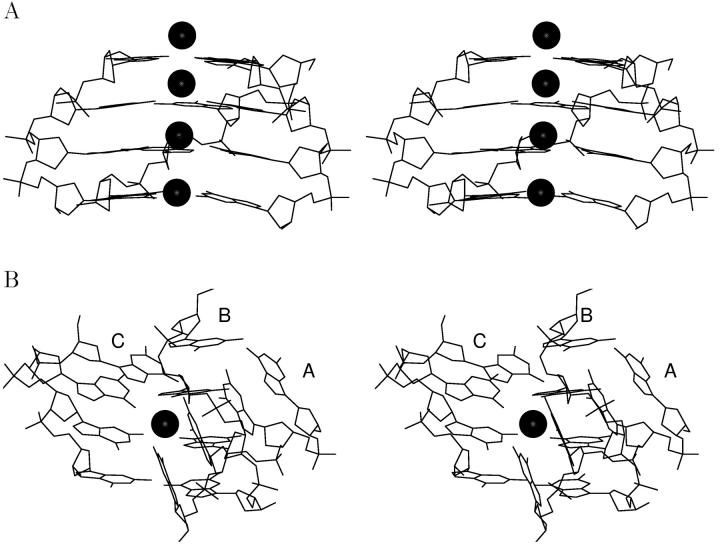
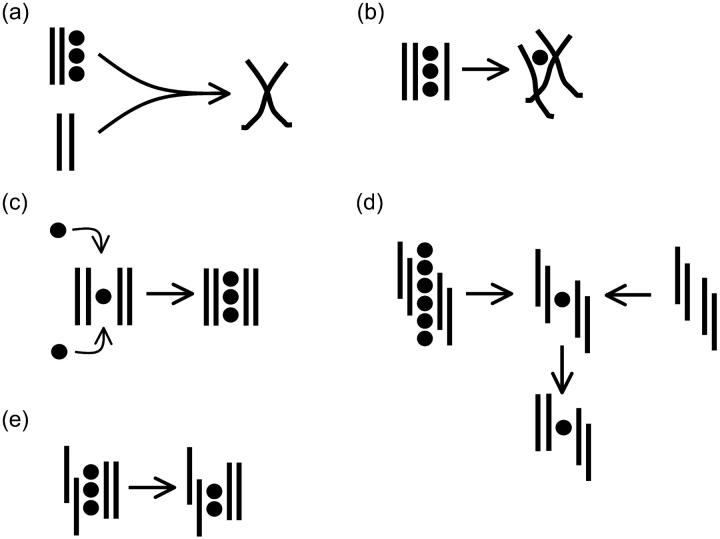
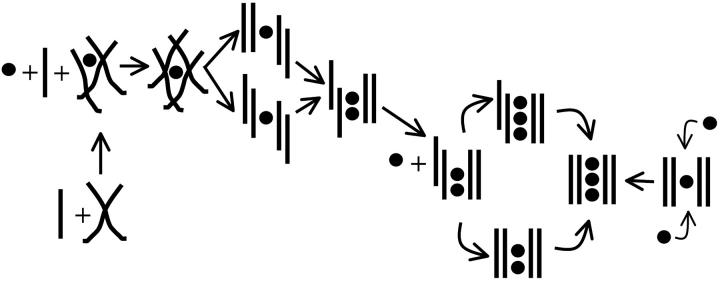
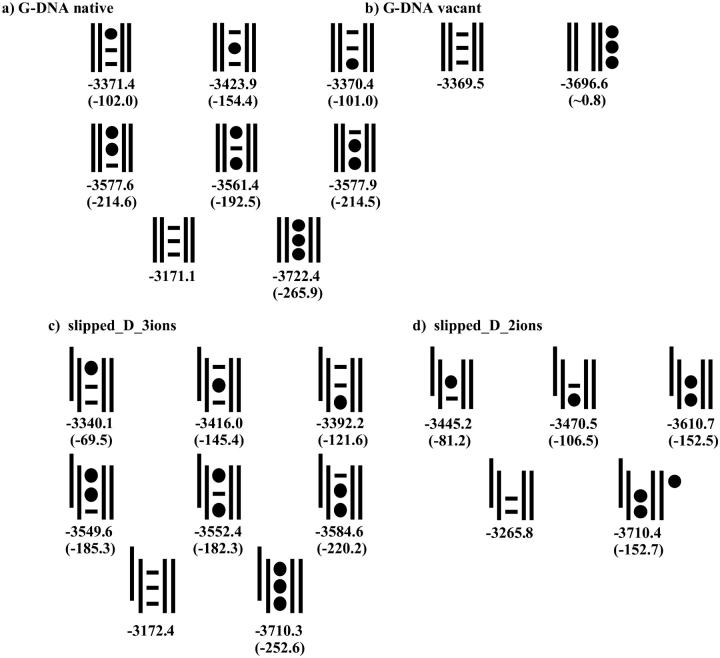
The formation of a cation-stabilized guanine quadruplex (G-DNA) stem is an exceptionally slow process involving complex kinetics that has not yet been characterized at atomic resolution. Here, we investigate the formation of a parallel stranded G-DNA stem consisting of four strands of d(GGGG) using molecular dynamics simulations with explicit inclusion of counterions and solvent. Due to the limitations imposed by the nanosecond timescale of the simulations, rather than watching for the spontaneous formation of G-DNA, our approach probes the stability of possible supramolecular intermediates (including two-, three-, and four-stranded assemblies with out-of-register base pairing between guanines) on the formation pathway. The simulations suggest that "cross-like" two-stranded assemblies may serve as nucleation centers in the initial formation of parallel stranded G-DNA quadruplexes, proceeding through a series of rearrangements involving trapping of cations, association of additional strands, and progressive slippage of strands toward the full stem. To supplement the analysis, approximate free energies of the models are obtained with explicit consideration of the integral cations. The approach applied here serves as a prototype for qualitatively investigating other G-DNA molecules using molecular dynamics simulation and free-energy analysis.


Figures

FIGURE 1
FIGURE 1
Schematic drawing of a guanine quadruplex stem formed by d(GGGG)4. This structure is stabilized by four stacked guanine quartet layers (left) and has all strands oriented in parallel (arrows) (right) with all anti glycosidic bonds.
FIGURE 2
FIGURE 2
Two predominant hypothetical models proposed for G-DNA formation from experiments (Hardin et al., 1991): (A) stepwise strand addition and (B) duplex dimerization.
FIGURE 3
FIGURE 3
Molecular structures of the parallel d(GGGG)4 stem, G-DNA native, (A), and intermediates studied here: (B) slipped_D_2ions, G-DNA stem with one strand shifted (from Spackova et al. (1999)); (C) shift_AB with A and B strands shifted down and up, respectively; (D) shift_AD with A and D strands shifted down and up respectively; and (E) d(GGGG)4 as a spiral stem with one central guanine quartet (F) d(GGGG)3 triplex, (G) parallel d(GGGG)2 edge duplex (G-DNA dimer_AB), and (H) parallel d(GGGG)2 diagonal duplex (G-DNA dimer_AC). See text for further details.
FIGURE 4
FIGURE 4
Stereo view of the 2–5 ns average structure from the shift_AB simulation.
FIGURE 5
FIGURE 5
View of the triad bases from the two ends of the shift_AB structure, including a representation of the hydrogen bonding between the bases. The triad geometry is regulated by the position of the cations stabilizing the adjacent quartet region.
FIGURE 6
FIGURE 6
Line drawing stereo representation of the simulated “spiral stem” structure: (A) starting model, (B) average structure at 7–9 ns, and (C) average structure at 10–11 ns of simulation. Only nonhydrogen atoms are depicted along with coordinated sodium ions along the helical axis of the four-stranded molecule (molecules are not shown in the same side view).
FIGURE 7
FIGURE 7
Stereo representation of the simulated parallel d(GGGG)2 “edge duplex”: (A) starting model; (B) average structure (last ns). Only nonhydrogen atoms are depicted along with coordinated sodium ions.
FIGURE 8
FIGURE 8
Stereo view of the simulated parallel d(GGGG)2 “diagonal duplex”: (A) starting model; (B) average structure at 3–4 ns of simulation. Only nonhydrogen atoms are depicted.
FIGURE 9
FIGURE 9
Stereo view of the simulated parallel d(GGGG)3 triplex structure: (A) starting model; (B) average structure at 4–8 ns of simulation. Only nonhydrogen atoms are depicted along with coordinated sodium ions in the molecule center.
FIGURE 10
FIGURE 10
Cartoon representation of the simulations performed and structural changes observed in various models on the G-DNA formation pathway. (A) Creation of the “cross-like” dimer from G-DNA parallel- and edge-like duplex models. (B) Creation of the ion-stabilized trimer structure from the G-DNA like triplex model. (C) Spontaneous capture of ions from the solvent by the vacant G-DNA quadruplex. (D) Creation of the single cation stabilized “spiral stem” and spontaneous strand slippage closer to the native quadruplex. (E) Only two ions appear necessary to stabilize the double slipped G-DNA quadruplex model structures.
FIGURE 11
FIGURE 11
Cartoon representation of a possible folding pathway as suggested by the simulations. The key intermediates are the following: 1), cross-like hydrogen-bonded duplexes that do not interact with ions and that possess free base hydrogen bonds capable of intercepting additional strands; 2), cross-like hydrogen-bonded triplexes that are modestly stabilized by a cation and still possess free base hydrogen bonds to intercept additional strands; and 3), a wide range of stable four-stranded intermediates with structured quartets stabilized by monovalent cations.
FIGURE 12
FIGURE 12
Schematic representation of the free energy of individual ion binding sites extracted from four-stranded d(GGGG)4 model trajectories: native and vacant stem, and single-slipped stems with two or three cations. Solid balls inside the double vertical lines (representing the DNA structure where the 5′ end is up) represent bound ions whereas those outside the DNA are free but associated ions (those closest to and outside the channel). Horizontal lines represent empty ion positions in the various models. Below each schematic model is the total free energy of the d(GGGG)4 model including the ions shown by solid balls, and in parentheses is the (total) ion-DNA interaction energy (defined as the absolute free energy of the d(GGGG)4-ion complex minus the free energies of the d(GGGG)4 model and ions calculated separately). All the free energies are in kcal/mol. Solute entropic components are not included. Note that for a reasonable comparison of the absolute free energies, the same number of explicit cations must be included into the analysis.

Similar articles

Cited by

References

    1. Andricioaei, I., and M. Karplus. 2001. On the calculation of the entropy from covariance matrices on the atomic fluctuations. J. Chem. Phys. 115:6289–6292.
    1. Aqvist, J. 1990. Ion-water interaction potentials derived from free energy perturbation simulations. J. Phys. Chem. 94:8021–8024.
    1. Arimondo, P. B., J. F. Riou, J. L. Mergny, J. Tazi, J. S. Sun, T. Garestier, and C. Helene. 2000. Interaction of human DNA topoisomerase I with G-quartet structures. Nucleic Acids Res. 28:4832–4838. - PMC - PubMed
    1. Arnott, S., and D. W. Hukins. 1972. Optimised parameters for A-DNA and B-DNA. Biochem. Biophys. Res. Commun. 47:1504–1509. - PubMed
    1. Arthanari, H., and P. H. Bolton. 1999. Porphyrins can catalyze the interconversion of DNA quadruplex structural types. Anticancer Drug Des. 14:317–326. - PubMed

Publication types

LinkOut - more resources